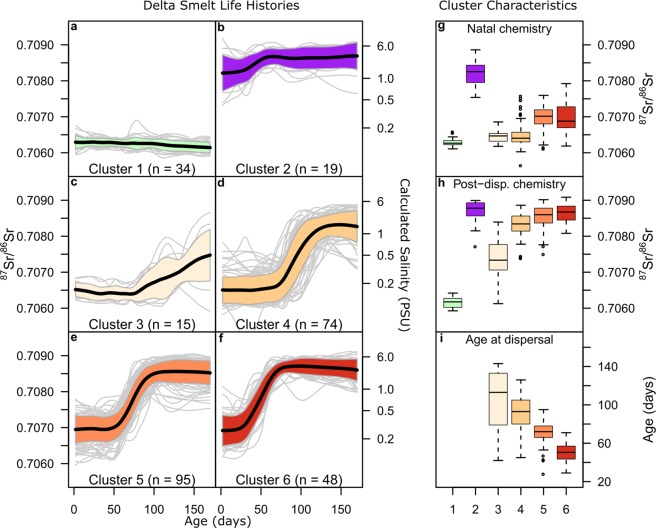
Figure 4.
Hierarchical cluster analysis of 285 fish into six clusters based on natal chemistry, post-dispersal chemistry, and age at transition. The mean 87Sr/86Sr profiles (solid black lines) and ±1σ (shaded area), as well as all individual profiles (light grey lines) from age 0–170 days are shown for all clusters in panels (a–f). Box plots for each cluster are shown for natal chemistry, post dispersal chemistry, and age at transition in panels (g–i).

