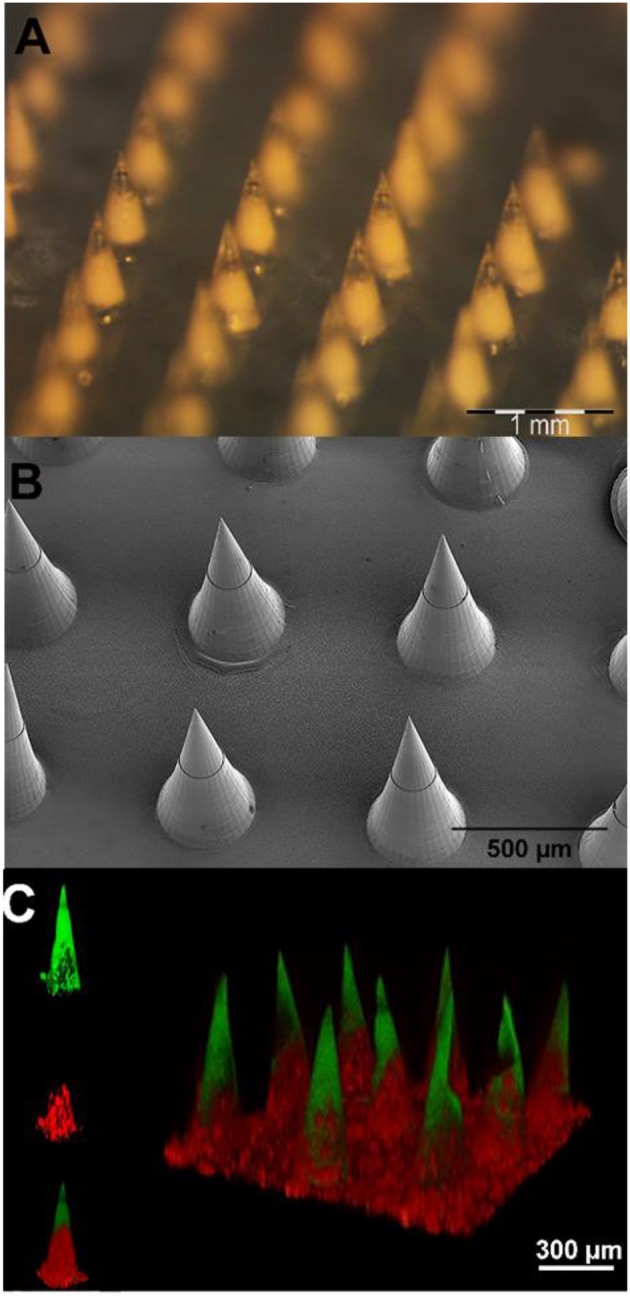
Figure 4.

(A) Stereomicroscope micrographs of microparticle-loaded microneedle patches. (B) Scanning electron microscopy images of microneedle arrays. (C) 3D confocal reconstruction of a microneedle array. The FITC loaded tips are shown in green, while the sulphorhodamine B loaded PLGA μPs are in red.
