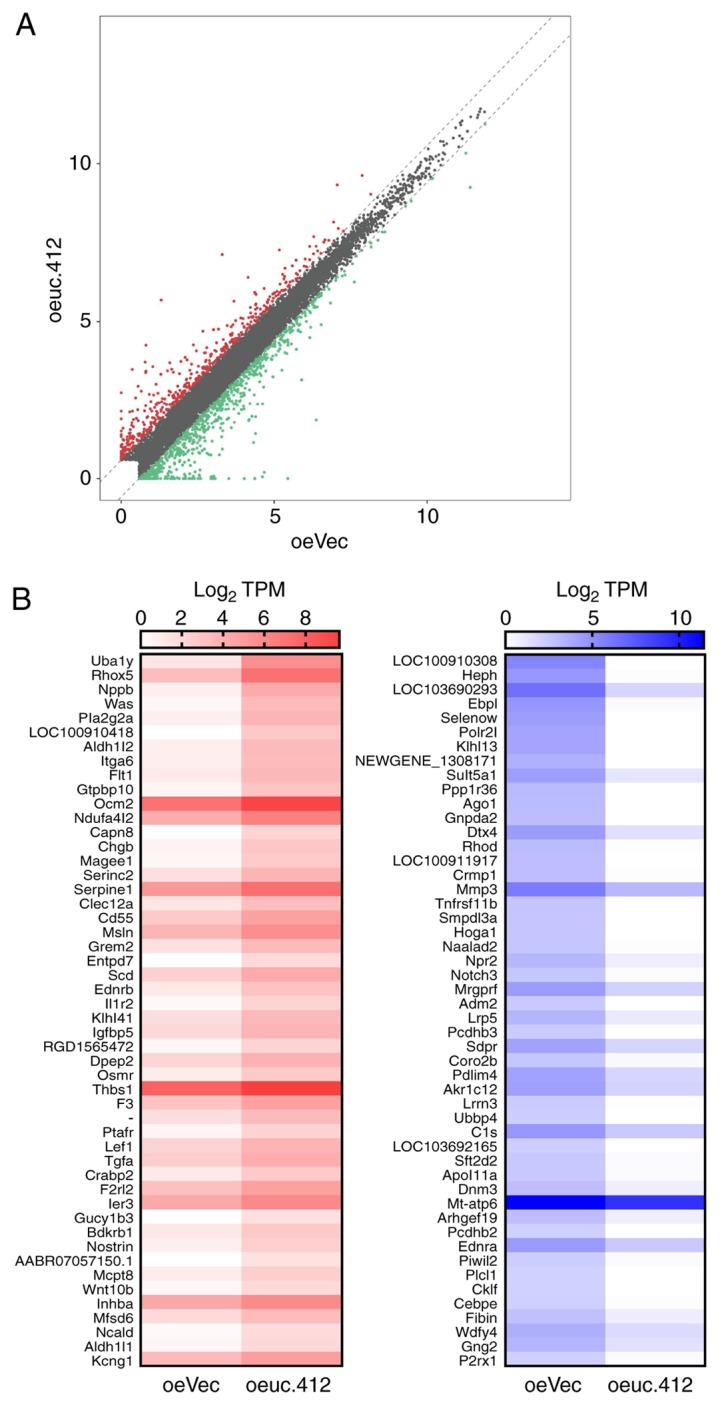
Figure 2.

Identification of DEGs between oeuc.412 and oeVec MCs. (A) Scatter plot used to determine gene expression variations between uc.412-overexpressing MCs and control MCs. Expression levels were detected and normalized as tag counts per million of TPM. In the scatter-plot, values on × and y axes represent the averaged TPM values of each group (log2 scaled). Red dots represent upregulated genes, and green dots represent downregulated genes, identified as changes of >1.5 fold change between the two comparison groups; gray dots indicate genes that were not differentially expressed. (B) DEGs between oeuc.412 MCs and oeVEC negative control. The top 50 upregulated genes and 50 downregulated genes with the highest difference in expression levels. In the left figure, red represent relatively high expression, and white represents relatively low expression. In the right figure, blue represents relatively high expression and white represent relatively low expression. DEGS, differentially expressed genes; MCs, mesangial cells; oe, overexpressing; uc.412, long non-coding RNA uc.412; vec, vector; TPM, total aligned tRNA reads.
