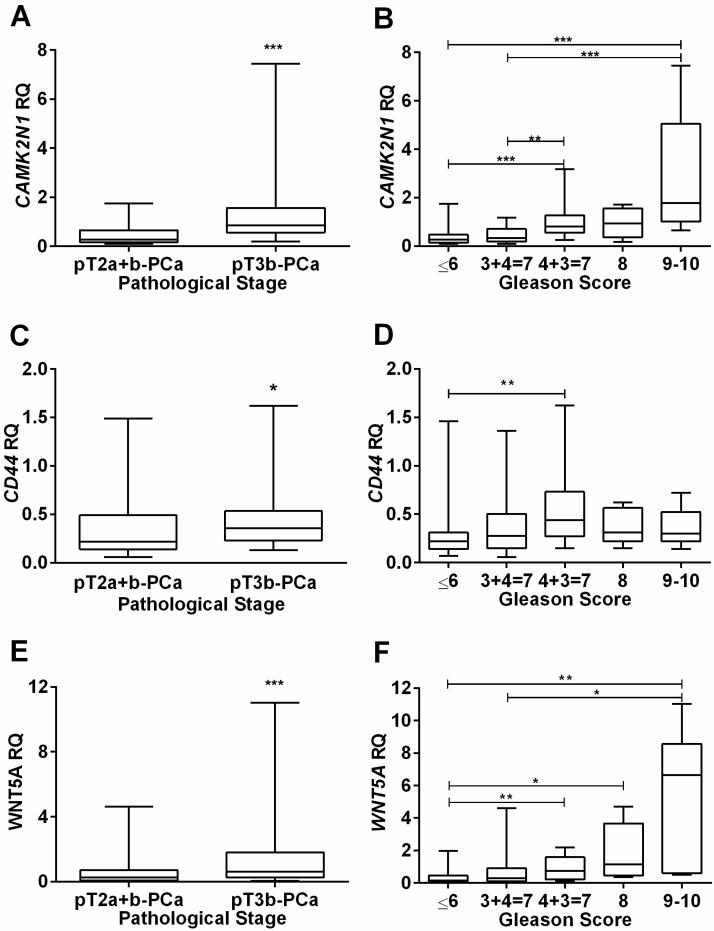
Figure 1.
Association of CAMK2N1, CD44 and WNT5A relative expression levels with clinicopathological data. Distribution of CAMK2N1(A), CD44(C) and WNT5A(E) expression levels according to pathological stage, showing higher expression levels in more advanced tumors, pT3b-PCa. Distribution of CAMK2N1(B), CD44(D) and WNT5A(F) expression levels according to Gleason Score, showing higher expression levels associated with a higher Gleason Score, mainly for CAMK2N1 and WNT5A.

