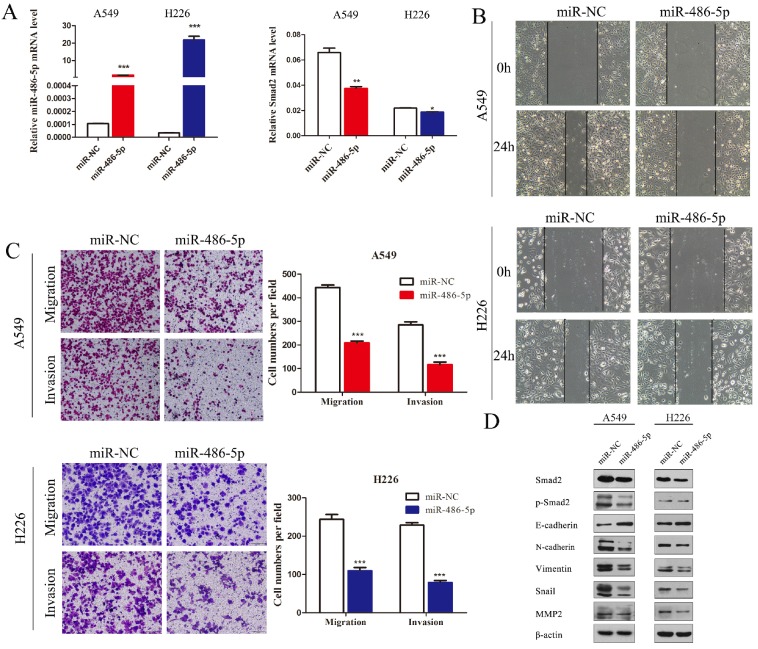
Figure 5.
MiR-486-5p represses SMAD2 expression, and the migration and invasion abilities of NSCLC cells. (A) miR-486-5p mimics were transfected into A549 and H226 cells for 48 h. The expression levels of miR-486-5p (left) and SMAD2 mRNA (right) were determined in the cells using qRT-PCR assay. (B) A uniform scratch was made in each confluent monolayer of A549 (upper) cells and H226 (bottom) cells transfected with miR-486-5p or miR-NC. Images were acquired at 0 h and 24 h post scratching under a microscope. (C) A549 and H226 cells transfected with miR-486-5p or miR-NC were allowed to migrate through an 8-µm pore in a Transwell apparatus. Migrated cells were stained and counted in at least three microscopic fields 24 h later. One representative image (left) is shown, and the number of migrated cells was compared between the miR-486-5p and miR-NC groups (right). After transfection with miR-486-5p for 48 h, A549 and H226 cells were subjected to western blotting to determine the expression of various proteins. β-actin was used as an internal control. Data are shown as the mean ± SD. *, **, and *** indicate significant differences compared with the control (* P < 0.05; ** P < 0.01; ***P < 0.001).

