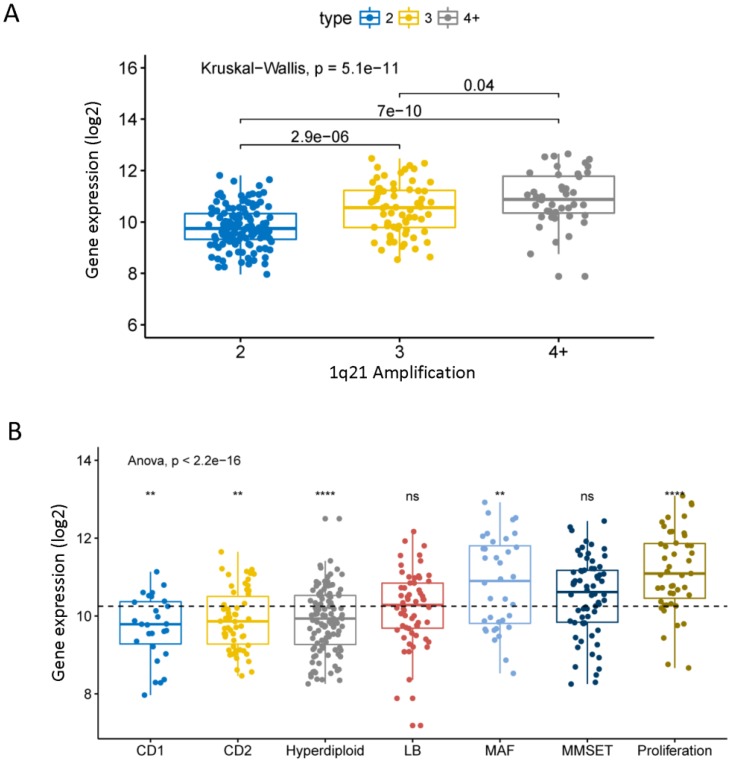
Figure 2.
The expression of CHML in different molecular subtypes of MM. A, The expression of CHML at different amplification levels of 1q21 in MM. B, The level of CHML in seven different molecular subtypes of MM. Different icons indicate different statistical saliency: ns: P > 0.05, *: P <= 0.05, **: P <= 0.01, ***: P <= 0.001, ****: P <= 0.0001. The dotted line represents the average of all values. The Y-axis represents the CHML expression (log2), and the X-axis represents the subtype of MM.

