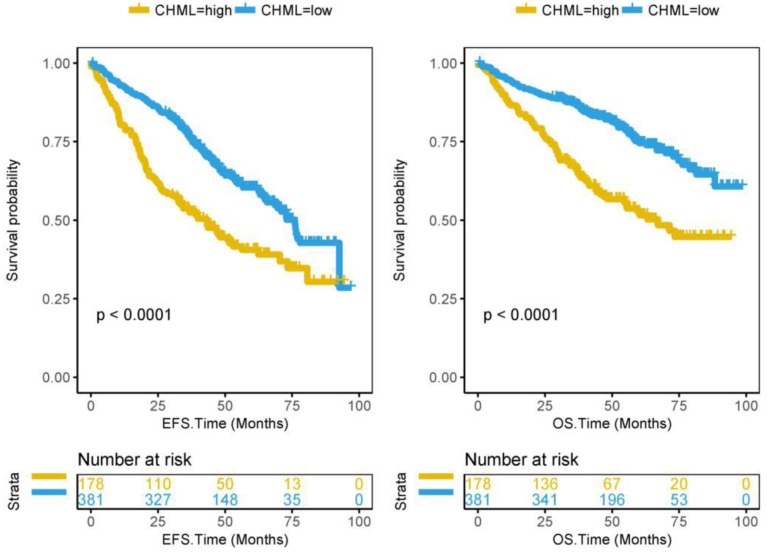
Figure 3.
Survival analysis of CHML gene in 559 MM patients from dataset GSE24080. Kaplan-Meier Curves for Event-free survival (left) and Overall survival (right) in 559 MM patients. Log-rank test was used. The Y-axis represents survival probability, and the X-axis represents survival time (months).

