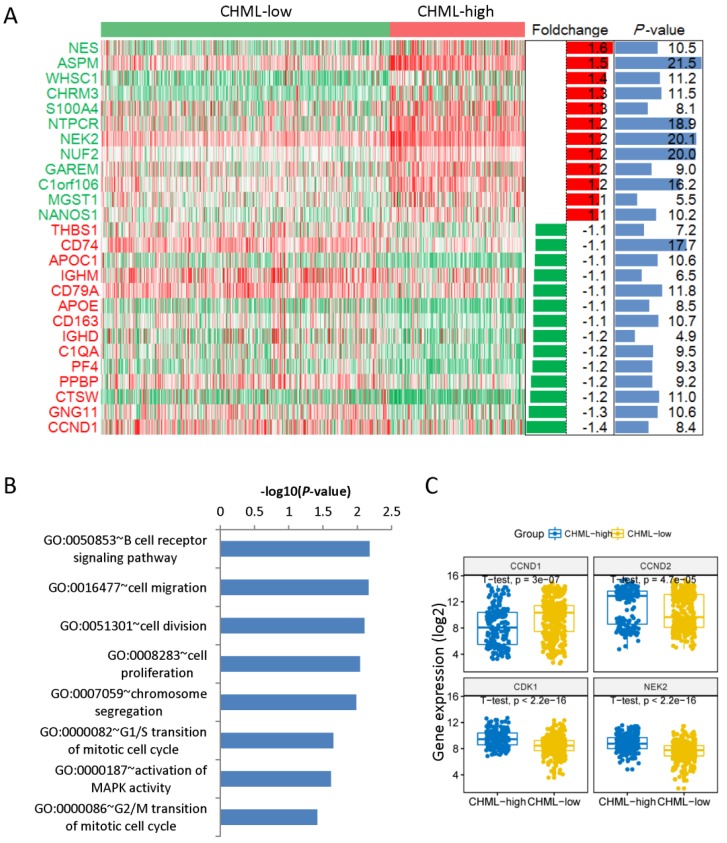
Fig 4.
Different expression of genes and enrichment pathways. A, Different expression genes between CHML-low group and CHML-high group. The heat map showed top12 up-regulated and top12 down-regulated genes (sorted by foldchange). The right side is the corresponding foldchange (log2) and P value (-log10). Red and green represent high and low expression of the CHML gene, respectively. B, The main enriched pathways for different expression genes (sorted by P value). C, The level of the four different expression genes in the cell division pathway was compared between CHML-low group and CHML-high group, respectively.

