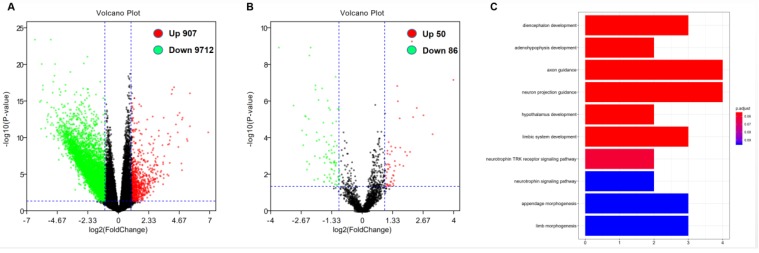
Figure 2.
Genome-wide gene/microRNA expression profiles and cell signaling pathways associated with DOCK2 expression. (A) Volcano plot of differential gene expression. Up-regulated and down-regulated genes were labeled with red and green dots, respectively. (B) Volcano plot of differential microRNA expression. Up-regulated and down-regulated microRNAs were labeled with red and green dots, respectively. (C) Gene ontology (GO) enrichment analysis of genes related to DOCK2 expression.

