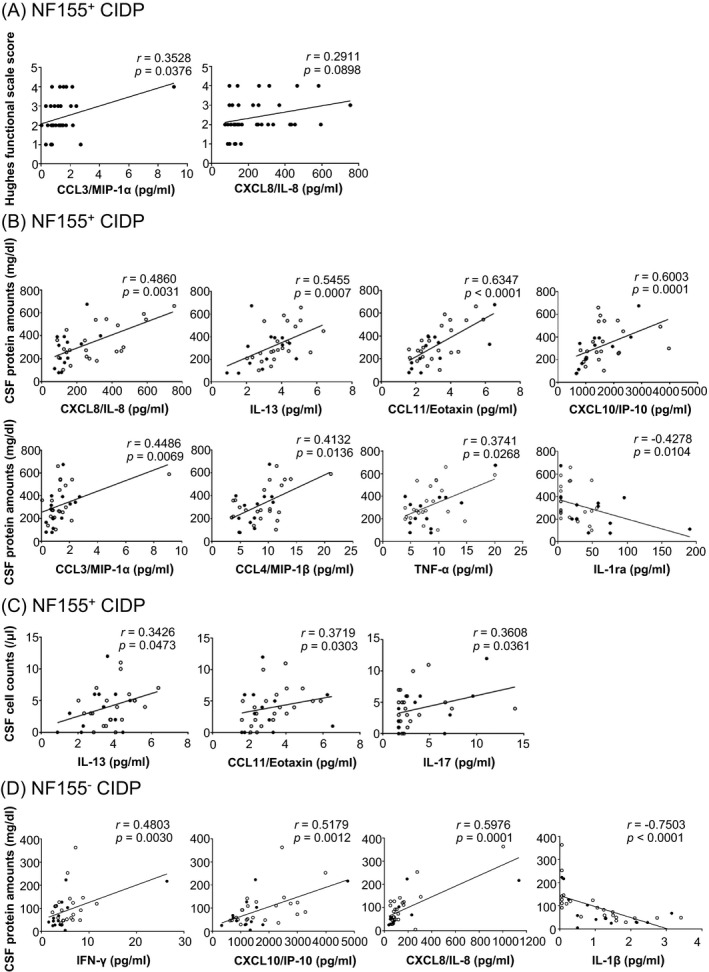
Figure 2.

Correlations of cytokine/chemokine levels with clinical severity and protein amounts and cell counts in CSF. (A) Correlations between CSF cytokine/chemokine levels and Hughes functional scale grade scores in NF155+ CIDP. When the outliner showing the extremely high CCL3/MIP‐1α level was excluded, the CCL3/MIP‐1α levels still showed a tendency to be positively associated with Hughes functional grade scores (r = 0.2984, P = 0.0865). (B, C) CSF cytokines and chemokines showing correlations with CSF protein amounts (B) and cell counts (C) in NF155+ CIDP patients. (D) CSF cytokines and chemokines showing correlations with CSF protein amounts in NF155− CIDP patients. Even when the two outliers showing the highest and second‐highest CXCL8/IL‐8 levels were excluded, the correlation remained statistically significant (r = 0.5216, P < 0.0016). Samples from untreated patients are indicated by open circles. Spearman’s rank correlation coefficient was used for this analysis. CCL = C‐C motif ligand; CIDP = chronic inflammatory demyelinating polyneuropathy; CSF = cerebrospinal fluid; CXCL = C‐X‐C motif ligand; G‐CSF = granulocyte colony‐stimulating factor; IFN = interferon; IL = interleukin; IP‐10 = interferon‐γ gamma‐inducible protein‐10; MIP = macrophage inflammatory protein; NF155 = neurofascin 155; NF155+ = IgG4 anti‐NF155 antibody‐positive; NF155− = anti‐NF155 antibody‐negative; TNF‐α = tumor necrosis factor‐α.
