Figure 4.

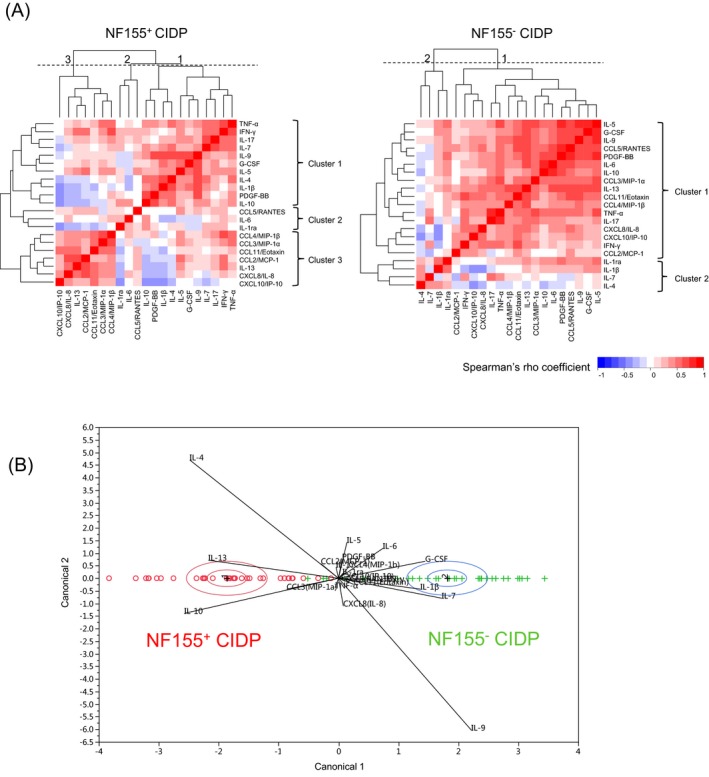
Cluster analysis of CSF cytokines/chemokines/growth factors in IgG4 anti‐NF155 antibody‐positive and ‐negative CIDP. (A) Clustering of correlations between each CSF cytokine level in patients with NF155+ (left panel) and NF155− (right panel) CIDP, respectively. Among the cytokines/chemokines/growth factors analyzed, the distance of each pair of cytokines/chemokines/growth factors based on Spearman’s correlation coefficient is shown as a heatmap. In NF155+ CIDP patients, there were three major clusters (clusters 1, 2, and 3). In NF155− CIDP patients, there were two major clusters (clusters 1 and 2). The numbers on each heatmap (1, 2, and 3) indicate the cut‐off position for each cluster. Dotted line: cut‐off level. (B) Canonical plot for 35 NF155+ (red) and 36 NF155− (green) CIDP patients. CIDP = chronic inflammatory demyelinating polyneuropathy; CSF = cerebrospinal fluid; CCL = C‐C motif ligand; CXCL = C‐X‐C motif ligand; G‐CSF: granulocyte colony‐stimulating factor; IFN = interferon; IL = interleukin; IP‐10 = interferon‐γ‐inducible protein‐10; MCP‐1 = monocyte chemoattractant protein‐1; NF155 = neurofascin 155; NF155+ = IgG4 anti‐NF155 antibody‐positive CIDP; NF155− = anti‐NF155 antibody‐negative CIDP; PDGF = platelet‐derived growth factor; RANTES = regulated upon activation, normal T cell expressed and secreted.
