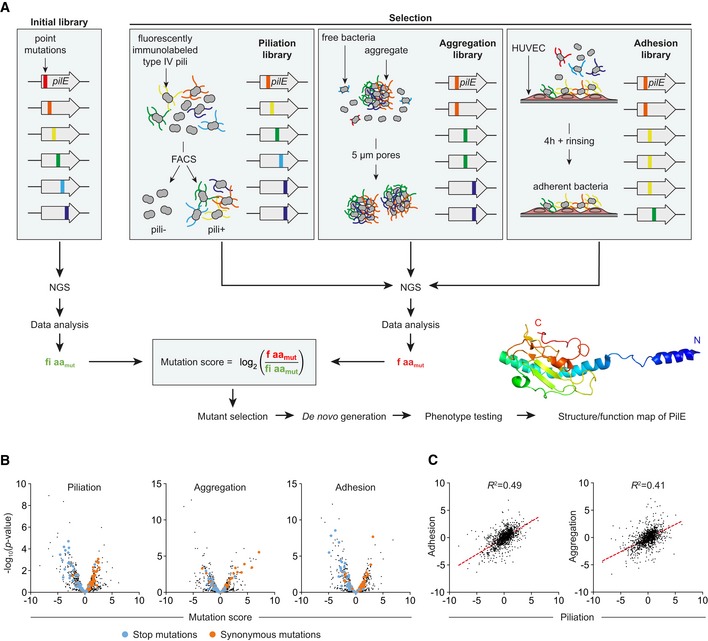
Figure 1. Deep mutational scanning of PilE.

- Representation of the overall work flow used in the study with the three selection schemes of pilE mutants and subsequent NGS‐based analysis.
- Volcano plots of piliation, aggregation, and adhesion mutation scores for all pilE mutations. Stop and synonymous mutations are highlighted in blue and orange, respectively.
- Adhesion and aggregation mutation scores relative to piliation. The correlation appears as a red dotted line.
