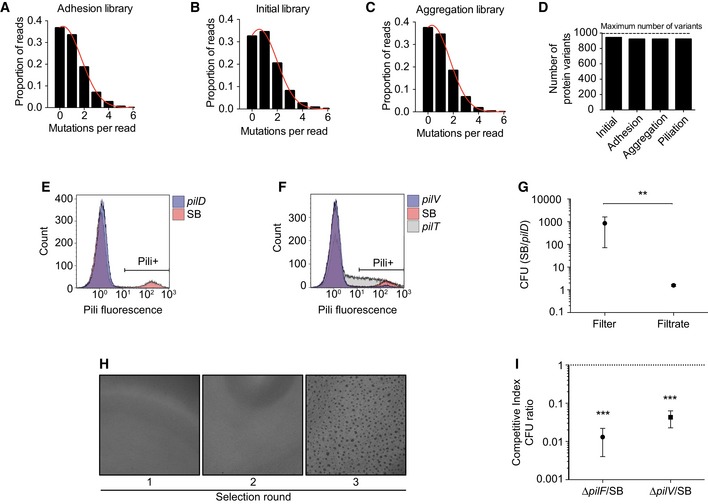
Figure EV1. Characterization of the libraries and selection schemes.

-
A–CDistribution of mutation counts per pilE read in each library assessed by NGS.
-
DNumber of single amino acid protein variants observed in each library relative to the theoretical maximum number of variants potentially obtained with single nucleotide mutations of pilE.
-
E, FPiliation selection. Flow cytometry analysis of pili expression using the 20D9 monoclonal antibody. The Pili+ gate was used to separate piliated bacteria in the wild‐type SB strain (10.5%), pilD (0.1%), pilV (3%), and pilT (28%).
-
G, HAggregation selection. (G) Ratio between the colony forming units of pilE SB and pilD after passage of a 1:1 mixture through a 5‐μm pore filters. Mean ratio ± SEM is indicated. N ≥ 3 independent experiments. Paired t‐test. P < 0.01 (**). (H) Brightfield images of aggregates after different rounds of selection.
-
IRatio between the colony‐forming units of pilE SB over pilF or pilV mutants after passage of a 1:1 mixture on HUVEC cells for 4 h of infection (MOI 100). Mean ratio ± SEM is indicated. N ≥ 3 independent experiments. Paired t‐test. P < 0.001 (***).
