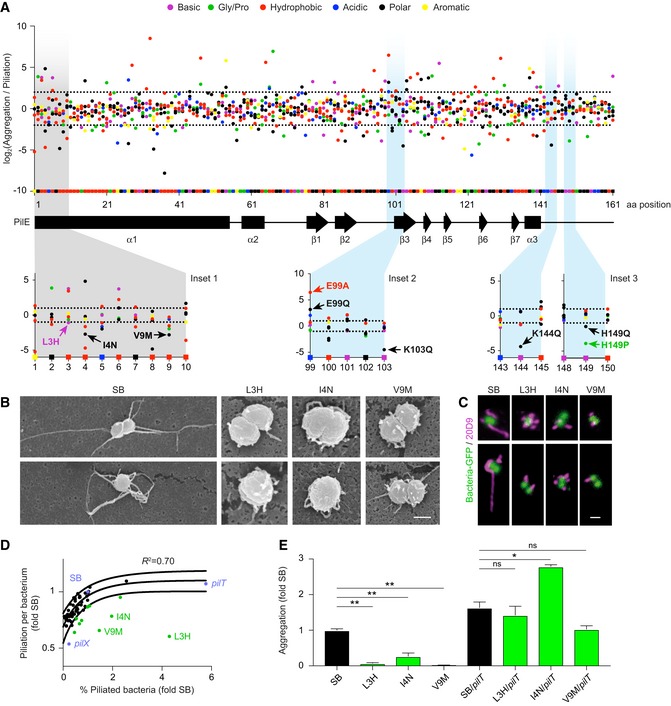
Figure 2. Implication of the amino‐terminal region in aggregation.

- The level of aggregation relative to piliation level is represented as the Log2 of the ratio between the frequency of each single‐point mutation in the aggregation library relative to the frequency of the same mutation in the piliation library. Each dot represents a point mutant. Mutation type is color‐coded as indicated in the legend. Squares on the x‐axis correspond to the original amino acids in the SB sequence with the protein secondary structure indicated below. Dotted lines represent a two‐fold threshold value. Bottom insets illustrate the mutations generated de novo and further analyzed in Figs 2 and 3.
- Scanning electron microscopy of single bacteria on a cellulose filter. Scale bar: 500 nm.
- Two representative immunofluorescence labeling of TFP. Scale bar: 1 μm.
- Piliation per bacterium as a function of the proportion of piliated bacteria normalized to pilE SB values as measured by flow cytometry using the 20D9 monoclonal antibody. Black dots indicate all the individual de novo‐generated PilE mutants that were characterized. Blue dots indicate mutants of the piliation machinery and green dots mutants in the α1N region. Solid lines indicate 95% confidence interval.
- Quantification of aggregation normalized to pilE SB for a subset of outliers and corresponding pilT double mutants. Mean values ± SEM are indicated for each strain. N ≥ 3 independent experiments. Paired t‐test. P < 0.05 (*), P < 0.01 (**).
