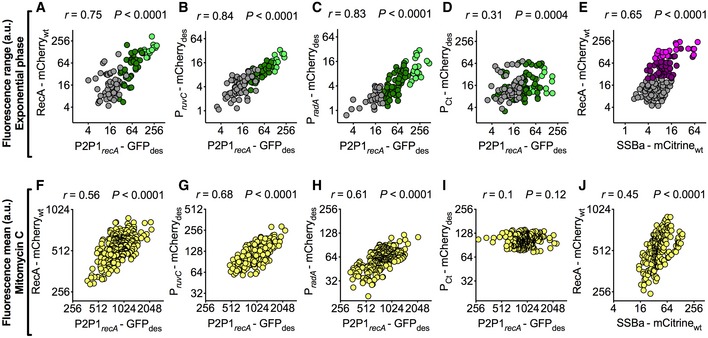
Figure 3. The DNA damage response is largely driven by extrinsic signals.

-
A–ESpearman's correlation between green (A‐D) or yellow (E) fluorescence range and red fluorescence range over the lifetime of the cell (105 < n < 153). The data shown are from two independent experiments. On the x‐axes, P2P1recA‐GFPdes (A–D) or a C‐term translational reporter of SSBa fused to mCitrinewt (E). On the y‐axes, a C‐term translational reporter of RecA fused to mCherrywt (A and E), transcriptional reporters of ruvC (B) and radA (C), and mCherry des expressed from a constitutive control promoter (D). Colors (A–D) indicate subpopulations segregated by VMR of P2P1recA‐GFPdes: gray (0 < VMR ≤ 1), dark green (1 < VMR ≤ 10), and light green (VMR > 10). Colors (E) indicate subpopulations segregated by VMR of RecA‐mCherrywt: gray (0 < VMR ≤ 1), plum (1 < VMR ≤ 10), and magenta (VMR > 10). See also Movie EV3.
-
F–JPearson's correlation between green (F–I) or yellow (J) fluorescence and red fluorescence, measured 3 h after MMC exposure (203 < n < 314). The data shown are from two independent experiments. On the x‐axes, P2P1recA‐GFPdes (F–I) or a C‐term translational reporter of SSBa fused to mCitrinewt (J). On the y‐axes, a C‐term translational reporter of RecA fused to mCherrywt (F and J), transcriptional reporters of ruvC (G) and radA (H), and mCherry des expressed from a constitutive control promoter (I). See also Movie EV3. Positive correlations between recA and other DNA damage markers both under normal growth conditions, where spontaneous DNA damage events occur at the subpopulation level, and in the presence of an alkylating agent that induces double‐strand breaks in the entire population, validate recA as a reliable proxy for DNA damage in single cells.
