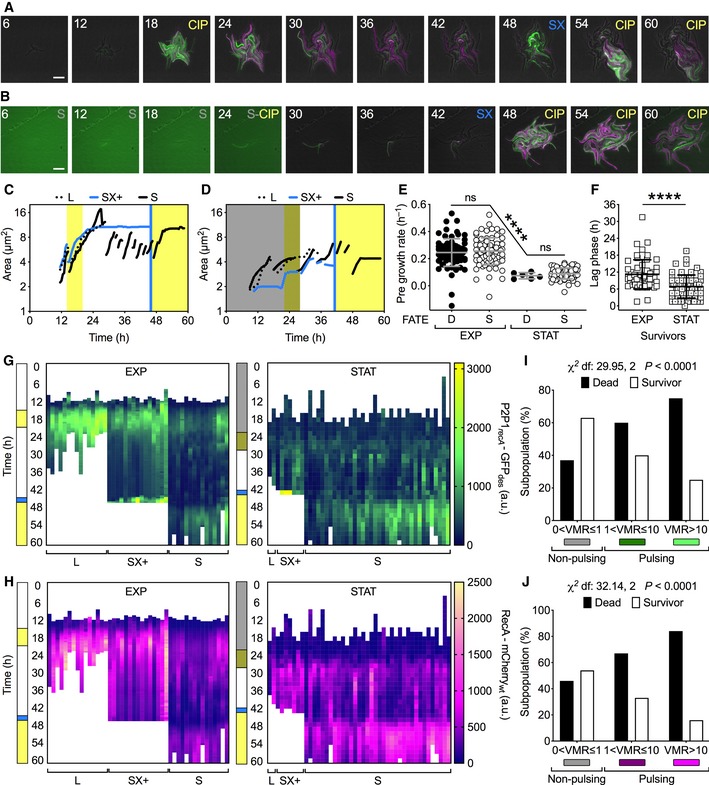
Figure 4. RecA pulsing is predictive of cell fate in M. smegmatis .

-
A, BRepresentative time‐lapse image series of the merodiploid recA reporter strain (P2P1recA‐GFPdes_RecA‐mCherrywt) cultured in fresh (A) or spent (B) flow medium (see Materials and Methods). Fresh 7H9 medium is unlabeled; spent medium (S), ciprofloxacin 1 μg/ml in fresh (CIP) or spent (S‐CIP) medium, and SYTOX 0.5 μM (SX) are labeled. Phase‐contrast (gray), GFPdes (green), and mCherrywt (magenta) fluorescence are merged. Fluorescence images of each channel are scaled to the brightest frame. Light green background in the first 4 frames (B) is due to the autofluorescence of spent medium. Cells were imaged at 30‐min intervals, and numbers represent hours. Scale bar, 10 μm. See also Movie EV4.
-
C, DRepresentative time traces of individual lineages of cells fed with fresh medium (C) or spent medium (D). Different styles are used for lineages with different fates: death and lysis (L); SYTOX‐positive (SX+); and survival (S). Line breaks represent division events in the same lineage, where a single random daughter cell is tracked for clarity. Vertical bars represent fresh (white) or spent (dark shading) 7H9 medium, CIP (yellow), and SX (blue).
-
E, FComparison of single‐cell growth rates prior to CIP exposure for “D” cells that die and “S” cells that survive and regrow after CIP washout (E), and lag time of regrowth (F). Cells were cultured in fresh (EXP) or spent (STAT) flow medium. Gray and black lines indicate mean ± SD. Significance by Kruskal–Wallis and Dunn's multiple comparison test (E) and unpaired Mann–Whitney U‐test (F): ns, not significant; ****P < 0.0001; 6 < n < 84. The data shown are from two independent experiments. Single‐cell fate is independent of the growth rate before exposure to the drug. However, cells cultured in spent medium (STAT) grow at significantly slower rates, survive at higher frequencies, and recover faster after CIP washout compared to cells cultured in fresh medium (EXP).
-
G, HRepresentative GFPdes (G) and mCherrywt (H) fluorescence time traces for single‐cell lineages of cells cultured in fresh medium (EXP) and cells cultured in spent medium (STAT), and having different fates. Vertical bars are color‐coded as in (C, D).
-
I, JSingle‐cell fate as a function of VMR of P2P1recA‐GFPdes (I) and RecA‐mCherrywt (J) fluorescence prior to CIP exposure. Significance by Chi‐square test of independence for cells that die (n = 84) and cells that survive (n = 54). The data shown are from two independent experiments. Cells that do not experience DNA damage prior to drug exposure (RecA‐non‐pulsing cells) survive more than cells that do experience DNA damage (RecA‐pulsing cells).
