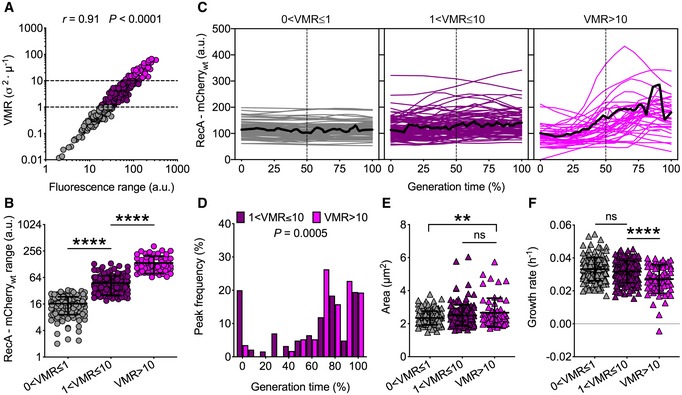
Figure 5. M. tuberculosis RecA‐mCherrywt expression dynamics under normal growth conditions.

-
ASpearman's correlation between single‐cell RecA‐mCherrywt fluorescence range and fluorescence VMR over the lifetime of the cell (n = 360). The data shown are from three independent experiments. Dashed lines separate different levels of dispersion, and colors denote subpopulations that are underdispersed (gray), dispersed (plum), or highly dispersed (magenta).
-
BRecA‐mCherrywt fluorescence of subpopulations segregated by fluorescence VMR (58 < n < 159). The data shown are from three independent experiments. Black lines indicate means ± SD. Asterisks denote significant difference by Kruskal–Wallis and Dunn's multiple comparison test: ****P < 0.0001.
-
CSingle‐cell time traces of RecA‐mCherrywt fluorescence expressed as percent of generation time of subpopulations segregated by fluorescence VMR. The average fluorescence (solid black lines) and half of the generation time (dashed lines) are indicated. Population statistics (n = 360): 40% (0 < VMR ≤ 1); 44% (1 < VMR ≤ 10); 16% (VMR > 10). The data shown are from three independent experiments.
-
DHistogram showing the distribution of the fluorescence peak time expressed as a percent of generation time. Bars shaded in plum indicate moderately pulsing cells (n = 185), and magenta bars indicate highly pulsing cells (n = 57). Significance by Mann–Whitney U‐test. The data shown are from three independent experiments. Peaks mainly occur between 80% and 100% of the generation time.
-
E, FSingle‐cell size (E) and growth rate (F) averaged over the lifetime of the cell (58 < n < 159). The data shown are from three independent experiments. Black lines indicate means ± SD. Asterisks denote significance by Kruskal–Wallis and Dunn's multiple comparison test: ns, not significant; **P = 0.002; ****P < 0.0001. Cells experiencing more DNA damage (VMR > 10) are slightly larger and grow at slower rates. See also Movie EV5.
