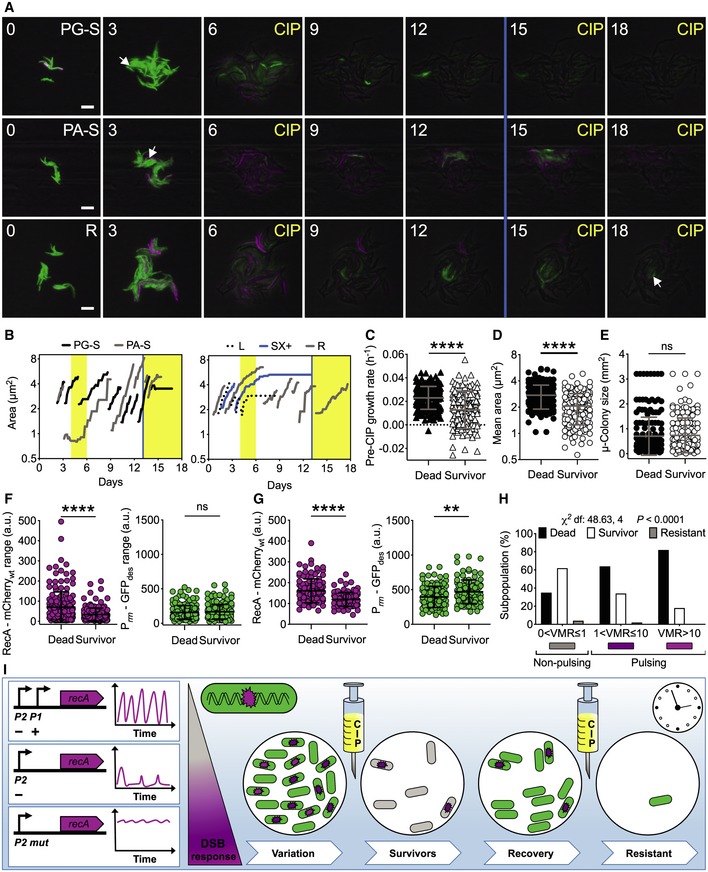
Figure 6. RecA pulses and growth rate influence M. tuberculosis fate during ciprofloxacin exposure.

-
ARepresentative time‐lapse image series of the dual reporter of RecA and rRNA expression in exponential phase. Pre‐CIP growing (PG‐S) and arrested (PA‐S) survivors and resistant (R) cells are indicated by arrows. CIP exposure (1 μg/ml, 4X‐MIC) and SX (0.5 μM) death assay (blue line) are indicated. Phase‐contrast (gray), Prrn‐GFPdes (green), and RecA‐mCherrywt (magenta) fluorescence are merged. Fluorescence images of each channel are scaled to the brightest frame. Cells were imaged at 3‐h intervals, and numbers indicate days. Scale bar, 5 μm. See also Movie EV6.
-
BRepresentative time traces of cell lineages with different fates. Vertical bars represent fresh 7H9 medium (white), CIP (yellow), and SX (blue).
-
C–GComparison of growth rate (C), cell size averaged over the lifetime of the cell (D), microcolony size (E) before CIP exposure, fluorescence range over the lifetime of the cell before CIP exposure (F), and mean fluorescence during CIP exposure (G) of cells that died (n = 174) and cells that survived (n = 164). Gray and black lines indicate mean ± SD. The data shown are from two independent experiments. Significance by unpaired Mann–Whitney U‐test: ns, not significant; **P = 0.001; ****P < 0.0001. Most survivors had a moderate growth defect before exposure to ciprofloxacin and lower expression of RecA‐mCherrywt both before and after drug exposure.
-
HSingle‐cell fate as a function of VMR of RecA‐mCherrywt fluorescence prior to CIP exposure. Significance by Chi‐square test of independence: cells that died (n = 174), cells that survived (n = 155), and resistant cells (n = 9). The data shown are from two independent experiments. More survivors arise from the subpopulation that does not experience DNA damage before drug exposure.
-
IThe intact architecture of the recA locus is required for pulsatile expression, which decreases in the absence of positive regulation and is abrogated in the absence of negative regulation. The presence of DNA damage is the main factor triggering RecA pulses. Schematic of M. tuberculosis reporters of DNA damage (magenta) and rRNA expression (green) during CIP treatment. In this study, we classified three subpopulations of bacilli under optimal growth conditions, with no, moderate, or high DNA damage response (magenta gradient scale). The rRNA reporter helped us to visualize the metabolic state of the bacilli and was crucial for early detection of survivors. Following the first drug exposure, 62% of DNA‐healthy cells survived, whereas 64% of cells with moderate and 82% of cells with high DNA damage died, suggesting that preexisting DNA damage in cells treated with ciprofloxacin is detrimental. During the recovery phase, all survivors resumed metabolic activity first and then underwent multiple divisions until they formed a new microcolony. At the time of second drug exposure, most survivors died, indicating that survival of the first drug exposure was not due to drug resistance. However, 0.3% of cells that survived both the first and second drug exposure exhibited drug resistance. In sum, the random state of DNA damage experienced by M. tuberculosis before exposure to a drug targeting DNA replication has consequences for the onset of drug tolerance and the ultimate efficacy of treatment.
