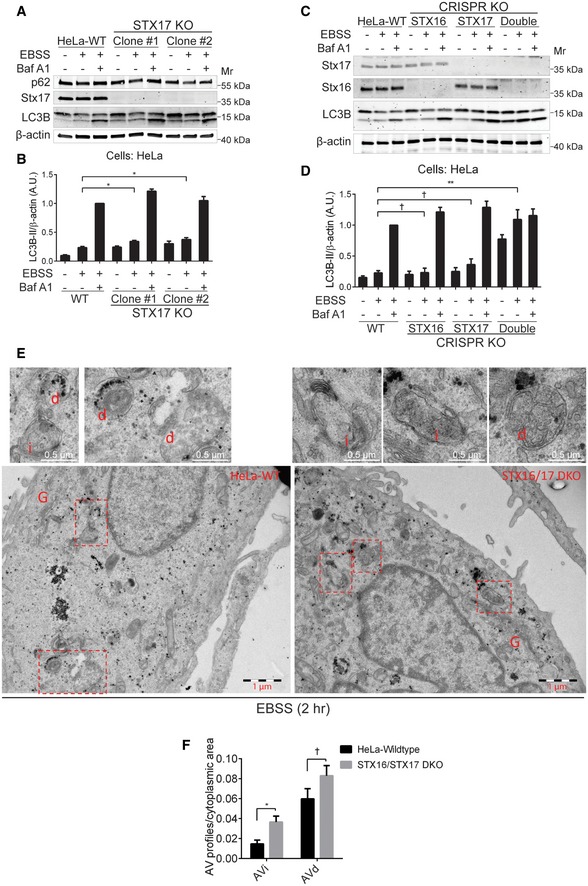
Figure 2. The mAtg8‐interacting SNAREs Stx16 and Stx17 are required for efficient bulk autophagic flux.

- WT or STX17 knockout (STX17 KO) HeLa cells were starved with or without the presence of bafilomycin A1 (Baf A1, 100 nM) for 2 h, and cell lysates were subjected to Western blot analysis of LC3B and p62.
- Quantifications of LC3B‐II levels normalized to β‐actin from cells treated as in (A); data shown as means ± SEM of LC3B‐II and β‐actin ratios, n = 3; *P < 0.05 (one‐way ANOVA).
- WT, STX16 KO, STX17 KO, or STX16/STX17 double KO (STX16/STX17 DKO) HeLa cells were starved with or without the presence of Baf A1 (100 nM) for 2 h, and cell lysates were subjected to Western blot analysis of LC3B.
- Quantifications of LC3B‐II levels normalized to β‐actin from (C); data shown as means ± SEM of LC3B‐II and β‐actin ratios, n = 3; †, not significant; **P < 0.01 (one‐way ANOVA).
- WT or STX16/STX17 DKO HeLa cells were starved in EBSS for 2 h and subjected to ultrastructural analysis of the autophagic vesicles (AV) with electron microscopy. AVi: initial autophagic vacuoles; AVd: degradative autophagic vacuoles; G: Golgi apparatus. Image acquisition and counting as in Methods. Scale bars, 1 μm and 0.5 μm (top sections).
- Quantifications of autophagic vesicles in WT and STX16/STX17 DKO HeLa cells treated as (E); data shown as means ± SEM of AV profiles relative to cytoplasmic area; †, not significant; *P < 0.05 (two‐way ANOVA). AV profiles from 47 images of each sample were counted.
Source data are available online for this figure.
