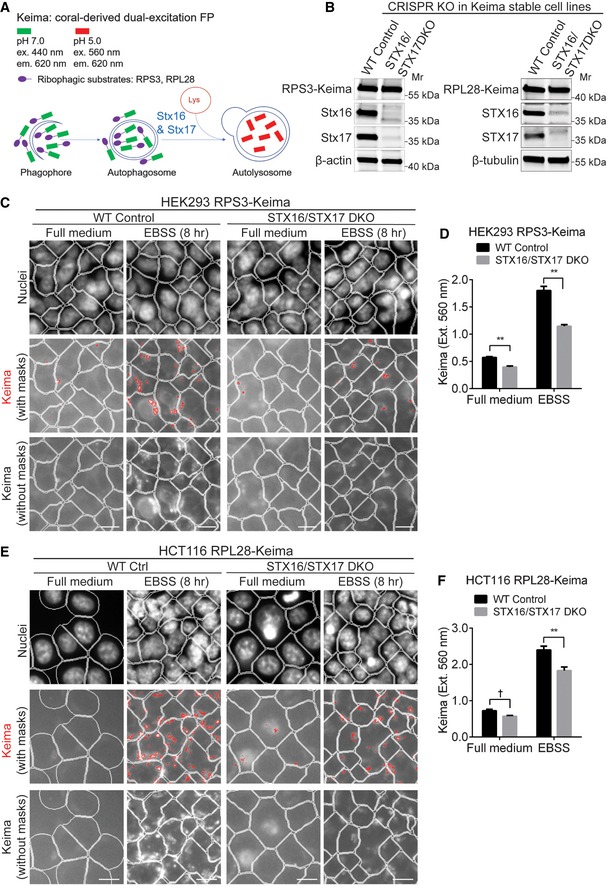
Figure 4. Stx16 and Stx17 cooperate in ribophagy.

- Schematic of ribophagy detection with Keima‐based reporter system; FP: fluorescent protein.
- Validation of STX16/STX17 DKO by Western blot analysis in HEK293 cells stably expressing RPS3‐Keima (left panel) and HCT116 cells stably expressing RPL28‐Keima (right panel).
- WT or STX16/STX17 DKO HEK293 RPS3‐Keima cells were cultured in full medium or starved for 8 h, and subjected to HCM analysis of Keima puncta accumulated in autolysosomes with the excitation wavelength at 560 nm. Masks: white, cells identified based on nuclei; red, Keima puncta detected with the excitation and emission wavelengths of 560 nm and 620 nm, respectively; lower panel shows Keima puncta without masks. Scale bar: 20 μm.
- Quantifications of autolysosomal Keima puncta in WT or STX16/STX17 DKO HEK293 RPS3‐Keima cells treated as in (C). Data shown as means ± SEM of Keima puncta per cell, minimum 1,000 cells were counted each well from at least 12 wells, three independent experiments; **P < 0.01 (two‐way ANOVA).
- WT or STX16/STX17 DKO HCT116 RPL28‐Keima cells were cultured in full medium or starved for 8 h, and subjected to HCM analysis of Keima puncta accumulated in autolysosomes with the excitation wavelength at 560 nm. Masks: white, cells identified based on nuclei; red, Keima puncta detected with the excitation and emission wavelengths of 560 nm and 620 nm, respectively; lower panel shows Keima puncta without masks. Scale bar: 20 μm.
- Quantifications of autolysosomal Keima puncta in WT or STX16/STX17 DKO HCT116 RPL28‐Keima cells treated as in (E). Data shown as means ± SEM of Keima puncta per cell, minimum 1,000 cells were counted each well from at least 12 wells, three independent experiments; †, not significant; **P < 0.01 (two‐way ANOVA).
Source data are available online for this figure.
