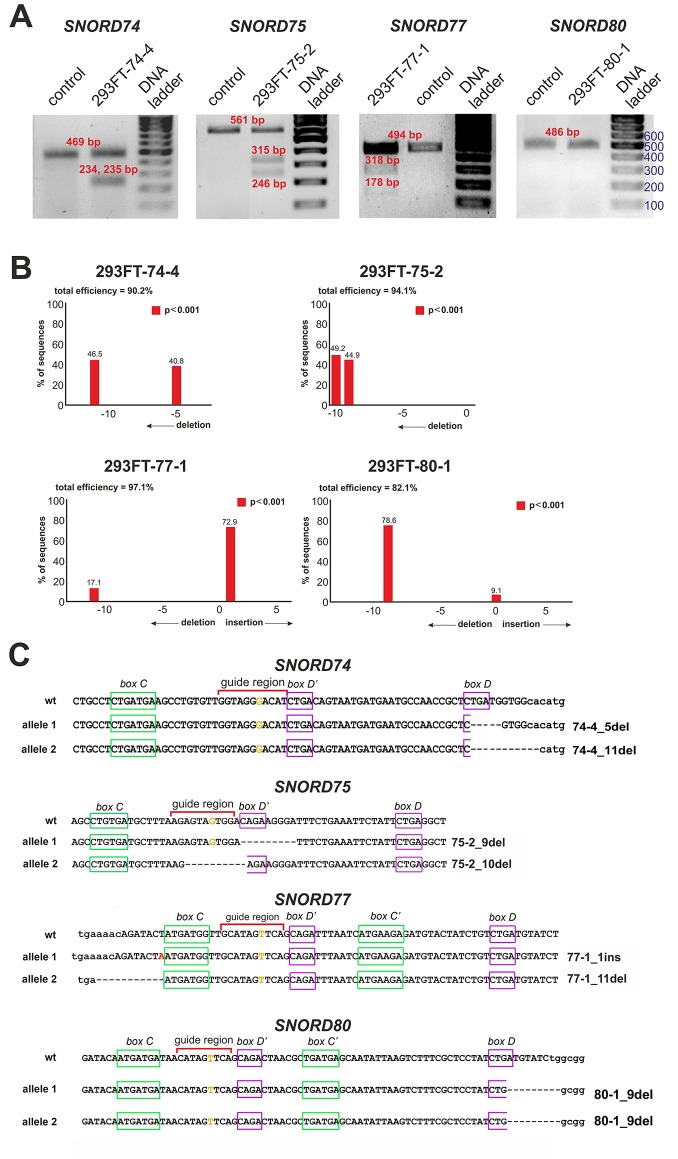
Figure 3.
(A–C) CRISPR/Cas9-mediated mutations in the Gas5 SNORDs in the obtained monoclonal cell lines. (A) T7 Endonuclease I assay with specific primers. Lengths of the Endonuclease restriction products correspond to the position of the CRISPR/Cas9 cleavage site in the target SNORD. (B) Sequencing of the genomic region of the target SNORD in the obtained cell lines followed by TIDE analysis. Position on the X axis indicates the number of deleted (negative value) or inserted (positive value) nucleotides, while Y value shows percentage distribution of the detected mutations. (C) Mutations in the alleles of the target SNORD in the obtained clones. Genomic sequences of the target snoRNAs are shown in capital letters. Conserved elements are framed in green and purple. The nucleotide denoted in ochre yellow in the guide region is complementary to the 2’-O-methylation site in the target rRNA. Insertion of 1 nucleotide in SNORD77 is denoted by red font. Deletion is indicated by dash line. WT, wild type allele.

