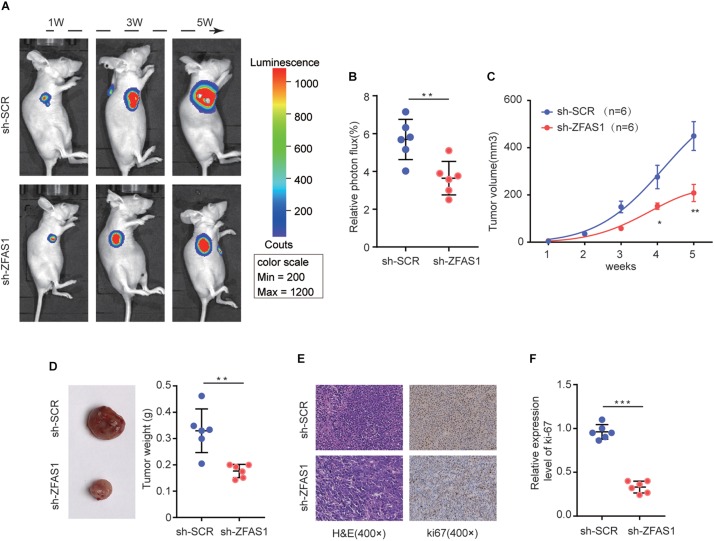
FIGURE 3.
The effect of ZFAS1 on tumor growth in vivo. (A) Representative image of Luciferase signal by a live imaging system. (B) Relative photon flux in sh-ZFAS1 group and sh-SCR group were quantified and analyzed using the IVIS imaging system. (C,D) Quantitative analysis of xenografted tumor volume and weight. (E,F) Representative hematoxylin and eosin (H&E) staining images and relative expression levels of immunohistochemical staining (IHC) for ki-67 in tumor sections from sh-ZFAS1 group and sh-SCR group. ∗p < 0.05, ∗∗p < 0.01, ∗∗∗p < 0.001.

