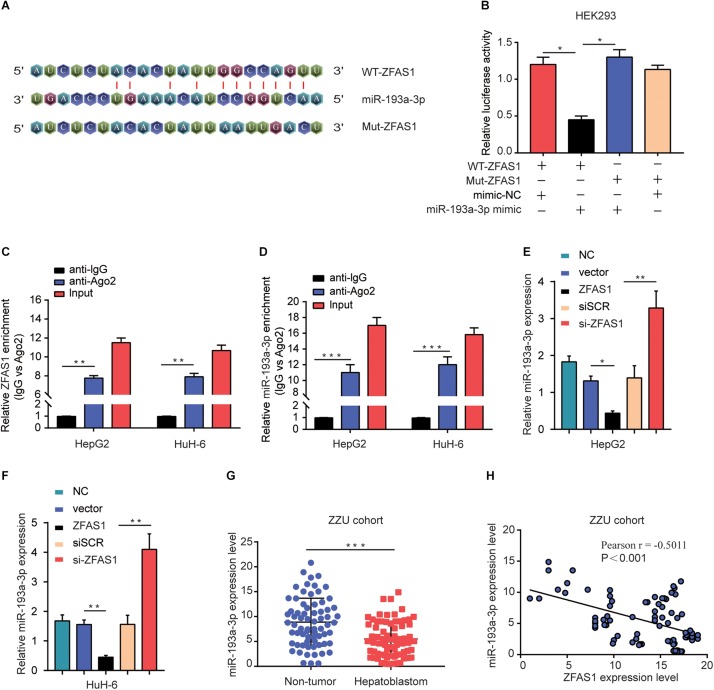
FIGURE 4.
ZFAS1 negatively regulates miR-193a-3p expression. (A) Graphical representation of the potential binding sites between ZFAS1 and miR-193a-3p. (B) The relative luciferase activity of pZFAS1-miR-193a-3p-wt and pZFAS1-miR-193a-3p-mut was tested. (C,D) RIP assay was performed to determine the association between ZFAS1 and miR-193a-3p in HepG2 cells. (E) miR-193a-3p expression level in HepG2 cells transfected with ZFAS1 or si-ZFAS1 was shown. (F) miR-193a-3p expression level in HuH-6 cells transfected with ZFAS1 or si-ZFAS1 was shown. (G) miR-193a-3p expression in HB tissues were quantified by qRT- PCR analysis. (H) The negative correlation between ZFAS1 and miR-193a-3p was displayed by Pearson’s correlation curve. ∗p < 0.05, ∗∗p < 0.01, ∗∗∗p < 0.001.

