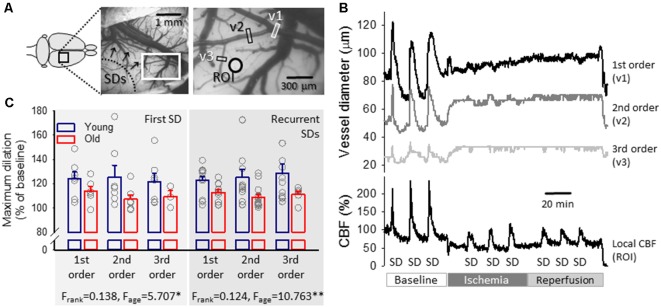
Figure 5.
Representative traces of the variation in pial arteriolar diameter and local CBF with spreading depolarization (SD) events in a young preparation and maximum dilation of pial arterioles in response to SDs elicited during baseline. (A) A representative field of view over the parietal cortex of a young rat at green light illumination. Pial arteriolar segments used for the measurement of diameter changes in panel (B) are indicated (v1: 1st order, v2: 2nd order, v3: 3rd order arteriole). A ROI designates the origin of the local CBF trace in panel (B). (B) The dilation of pial arterioles in response to SD events (top), with the corresponding changes in local CBF (bottom) in a representative young preparation. (C) Maximum dilation of 1st, 2nd and 3rd order pial arterioles in response to the first and recurrent SDs in normally perfused cortex in the two age groups. Individual values are gray symbols; bars show mean ± SEM (SD1: n = 6–7/3–6, young/old; recurrent SD: n = 11–13/5–13, young/old). A multivariate ANOVA paradigm was used for statistical analysis, considering vessel rank or age as factors (*p < 0.05 and **p < 0.01).

