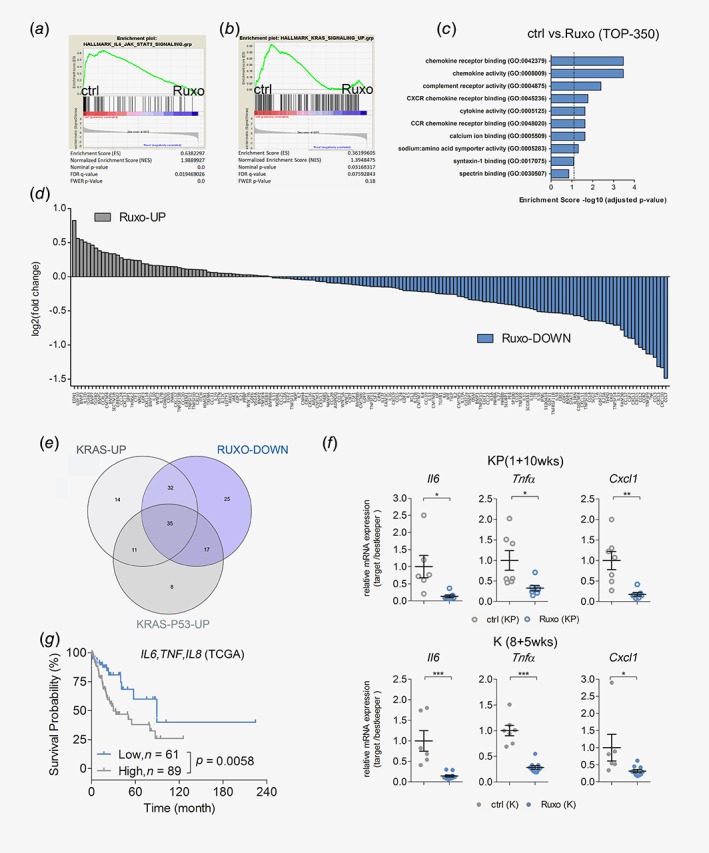
Figure 5.

JAK inhibition abrogates expression of oncogenic chemokines and cytokines. (a) GSEA of RNA‐seq data of lungs of K‐ras G12D (K) mice 8 weeks post tumor induction, treated with vehicle control (ctrl) or ruxolitinib (Ruxo) for four consecutive days before harvesting (n = 4 per group). The used genesets are HALLMARK_IL6_STAT3_SIGNALING and (b) HALLMARK_KRAS_SIGNALING_UP, comparing ctrl and Ruxo treatment. (c) Graph depicting the adjusted p‐values of enrichment scores of indicated GO‐molecular function pathways in ctrl versus Ruxo treated K mice. The top 350 genes downregulated in lungs of Ruxo treated mice compared to ctrl treated mice were included in the analysis. (d) Graph shows DESeq calculated log2 fold changes in mRNA expression of indicated up‐ or downregulated chemokine/cytokine related genes in tumor bearing lungs of Ruxo treated compared to ctrl treated K mice. (e) Venn diagram depicting amount of overlapping chemokine and cytokine related genes in all three groups. The defined 35 common genes were found by intersecting the after gene data sets: genes downregulated in tumor bearing lungs of Ruxo treated mice compared to ctrl treated mice (RUXO‐DOWN), genes upregulated in K‐ras G12D mutated alveolar type‐II cells compared to WT alveolar type‐II cells (KRAS‐UP, GSE113146) and genes upregulated in K‐ras‐p53‐mutated tumor‐harboring lungs compared to WT lungs from KP mice (KRAS‐P53‐UP). (f) Relative mRNA expression of the indicated genes normalized to housekeeping genes (28s, Tbp, Actb) in tumor harboring lungs of vehicle control versus ruxolitinib treated KP mice (upper) and K mice (lower). (g) Graph depicts prognostic value of indicated genes in human K‐RAS‐mutated lung AC samples. Patients were stratified according to auto best cut‐off selection. Data were retrieved from the Cancer Genome Atlas (n = 150). Log‐rank test was used for statistical analysis. For (f) Student's t‐test. *p < 0.05, **p < 0.01, ***p < 0.001. Data presented as means ± SEM. [Color figure can be viewed at http://wileyonlinelibrary.com]
