Figure 2.

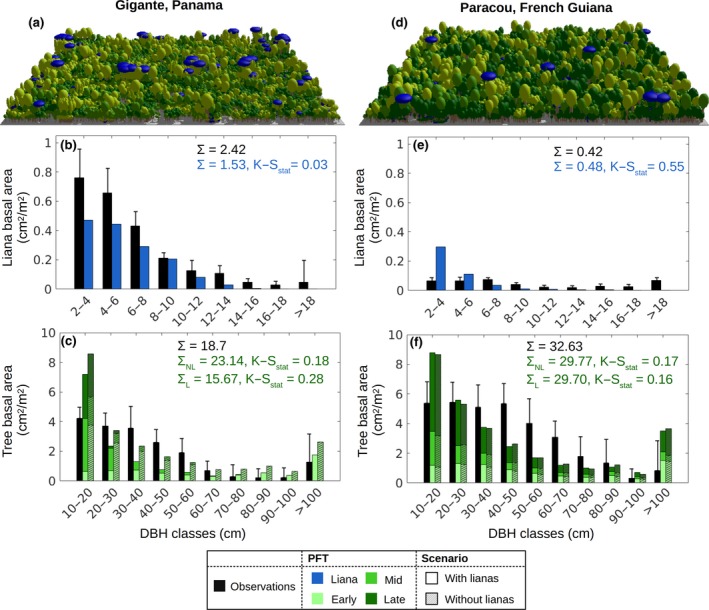
Forest demographic composition for the two simulated sites: Gigante, Panama (a–b–c), and Paracou, French Guiana (d–e–f). Panels (a) and (d) show a representative area of modeled forest of 1 ha. To visualize the forest composition, the forest is decomposed into patches according to their simulated relative area, and the three cohort densities and sizes are preserved (as well as the liana tree tracking). Panels (b–c) and (e–f) compare the basal area distributions of liana and tree PFTs, respectively, as observed locally (black) or simulated according to the ED2 (shades of blue and green). Tree basal area values (panels c and f) are compared for the simulations with (solid bars) or without (hatched bars) lianas. Σ represents the total basal area according to the model (blue or green) and field observations (black). Error bars represent the standard deviation of the different plot measurements (smaller error bars correspond to more homogeneous plots). The K–Sstat is the test statistic of the two‐sample Kolmogorov–Smirnov test between the observed and simulated size distributions (with a sampling size of 250 for each distribution). Liana basal area in Gigante was the only case in which the observed and simulated distribution did not significantly differ
