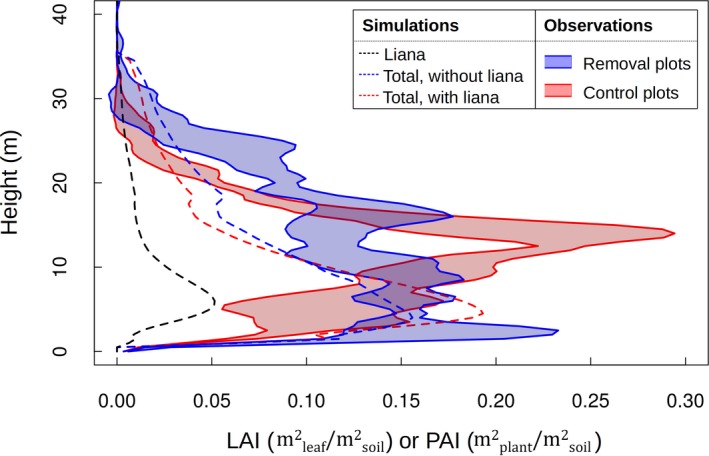
Figure 3.

Modeled vertical distribution of the LAI in simulations with (red dashed line) or without (blue dashed line) lianas and TLS‐derived PAI profiles in control (red envelopes) and removal (blue envelopes) plots for Gigante, Panama. The shaded areas delimit the mean plus or minus one standard deviation, as calculated from the three vertical distributions scanned for each treatment. The black dashed line is the liana contribution to the total LAI vertical distribution. The modeled vertical distributions were calculated as the area‐weighted average of all patches in the simulated forest using 0.5 m height intervals and were reconstructed by distributing the LAI of the flat‐top crown over a DBH‐dependent crown depth (Bohman & O'Brien, 2006)
