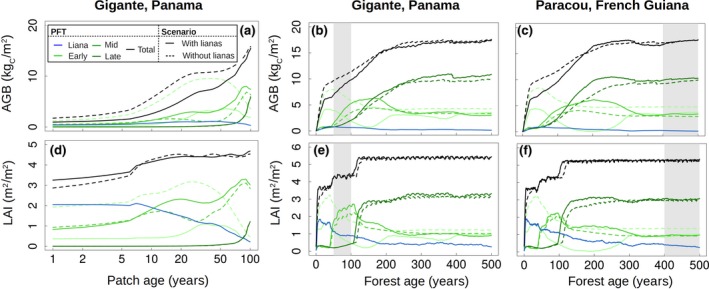
Figure 4.

Comparison of simulations with (solid lines) and without (dashed lines) lianas. The upper graphs (a–c–e) show the above‐ground biomass (AGB), while the bottom graphs (b–d–f) represent LAI as a function of time for one patch (a–d) and for the forest aggregate (b–c–e–f). The gray zones represent the period during which the model outputs were averaged for all other plots (corresponding to the approximate stand age of the forest sites). The increases in LAI are caused by the crossing of the reproductive thresholds for the different plant functional types (PFTs)
