6.
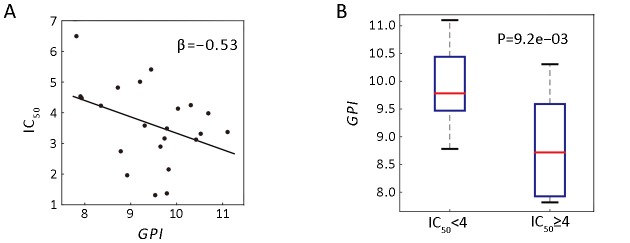
Correlation analysis of GPI expression and 5-fluorouracil (5-FU) drug sensitivity. (A) Scatter plot shows the negative relationship between half maximal inhibitory concentration (IC50) and GPI expression of 22 GC cell lines. The β-value represents the coefficient of linear regression; (B) Box-plot of GPI expression of gastric cancer (GC) cell lines grouped by higher sensitivity (IC50 <4, n=13) and lower sensitivity (IC 50 ≥4, n=9) (P=9.2e−03). The P-value is generated by Student’st-test. GPI, glucose-6-phosphate isomerase.

