S1.
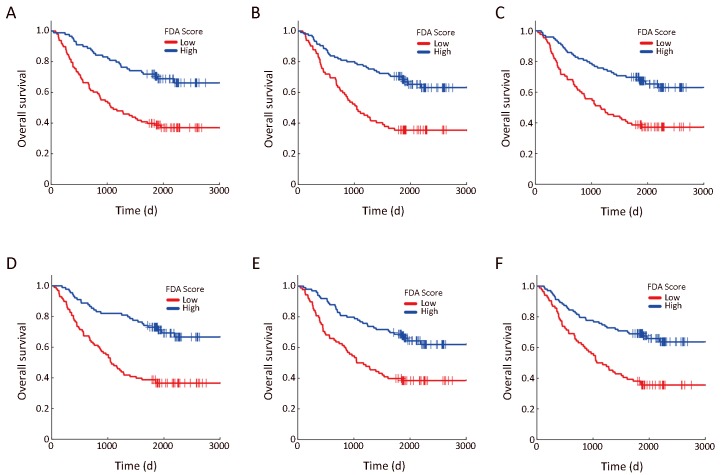
Kaplan-Meier (KM) plots of six mRNAs in the first level. KM plots for overall survival of patients divided by Fisher’s discriminant analysis (FDA) scores of mNRAs in the first level (see Figure 1 in the main text). Blue curves represent the low-risk group with FDA scores higher than the median value; red curves represent the high-risk group with FDA scores lower than the median value. (A) GPI (P=6.17e−06); (B) PLA2G2A (P=9.25e−06); (C) IGFBP2 (P=4.41e−05); (D) EIF3B (P=1.66e−06); (E) COASY (P=6.76e−05); (F) FXN (P=2.15e−05).

