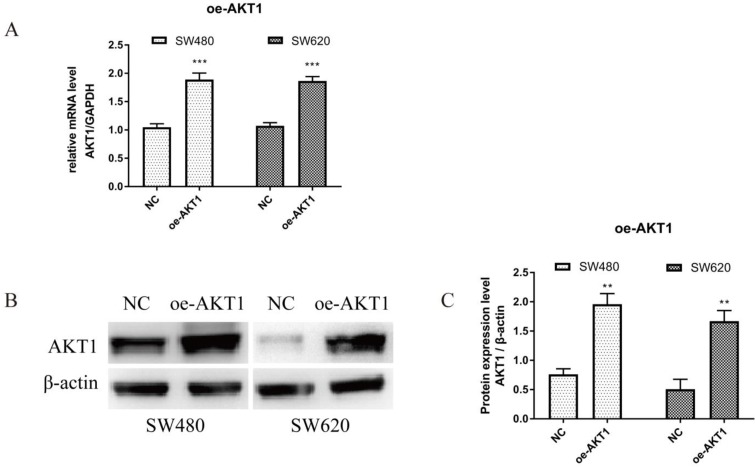
Figure 7.
AKT1 was successfully overexpressed in SW480 and SW620 cells. (A): Real-time quantitative PCR (qPCR) showed that mRNA expression of AKT1 in SW480 and SW620 cells transfected with oe-AKT1 was significantly increased compared with that of the two cell lines transfected with NC. (B-C): Western blotting showed that the protein expression of AKT1 in SW480 and SW620 cells transfected with oe-AKT1 was significantly increased compared with that of the two cell lines transfected with NC. Compared with NC group, **P<0.01, ***P<0.001; n=3.

