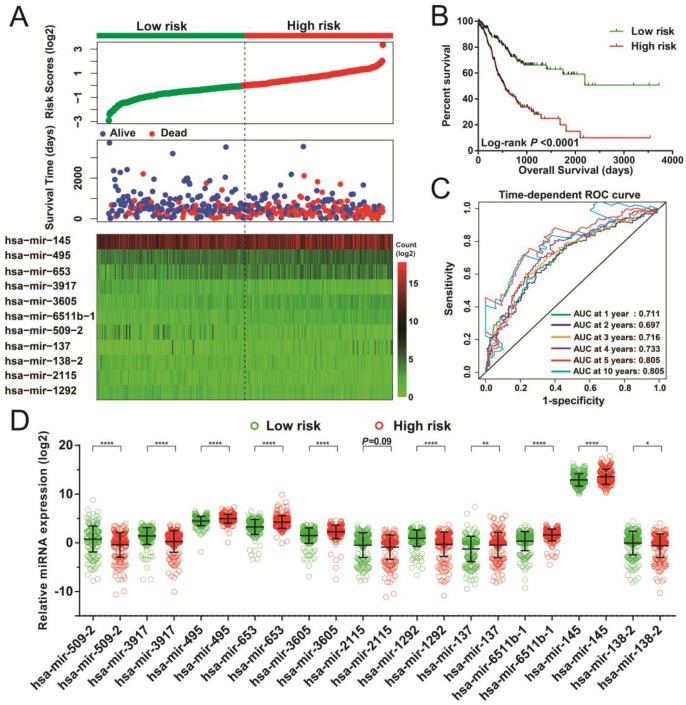
Figure 3.
Risk score model of the 11 prognostic miRNAs in STAD patients. (A) Risk score is expressed from top to bottom together with the distribution of the patients' survival status. Heat maps of the 11 prognostic miRNAs expression between the lower- and higher-risk groups are also indicated. (B) Survival analysis between the lower- and higher-risk groups. (C) ROC curve for the determination of the survival rate in patients with STAD based on the risk score. (D) Expression levels of these 11 prognostic miRNAs in groups stratified according to risk score. *P < 0.05, **P < 0.01, ****P < 0.0001.

