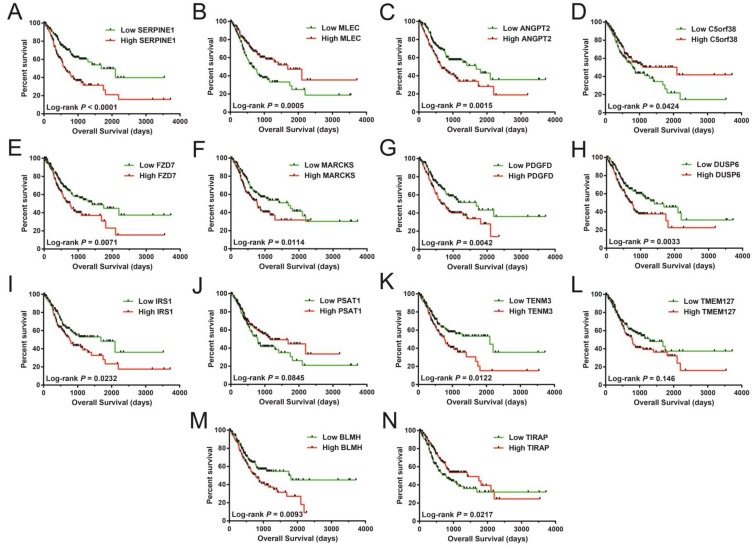
Figure 8.
Survival analysis of these targeted genes showed significant association with STAD OS. The order of the Kaplan-Meier curves of these genes is as follows: SERPINE1 (A), MLEC (B), ANGPT2 (C), C5orf38 (D), FZD7 (E), MARCKS (F), PDGFD (G), DUSP6 (H), IRS1 (I), PSAT1 (J), TENM3 (K), TMEM127 (L), BLMH (M), and TIRAP (N).

