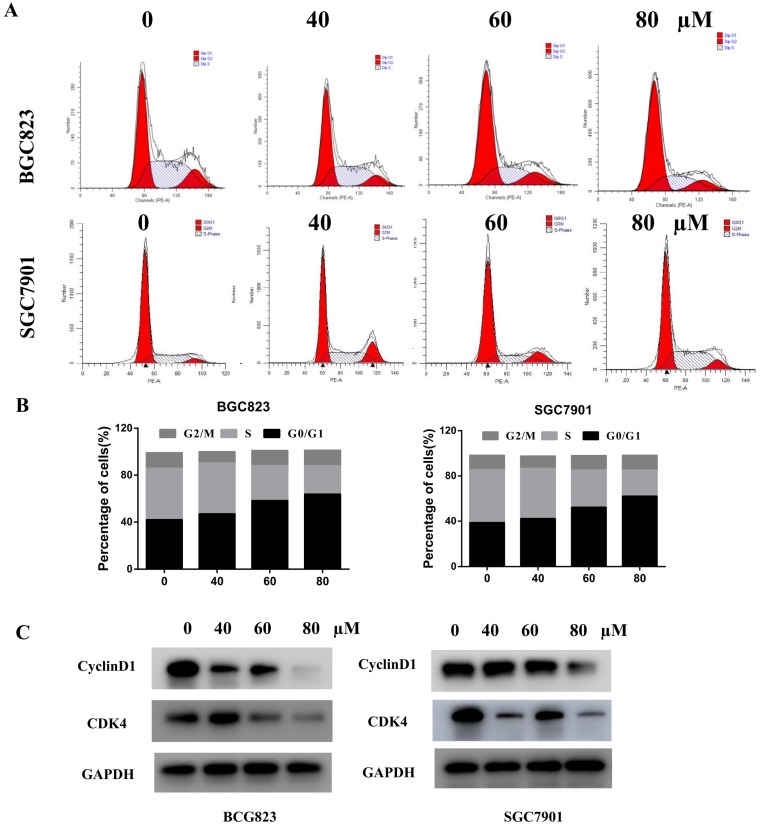
Figure 3.
Liensinine induces cell cycle arrest at the G0/G1 phase. A-B) The cell cycle phases of treated cells were evaluated by flow cytometry. The x- axis represents the periodic distribution, and the y- axis represents the number of cells. C) The protein levels of cell cycle regulators, such CDK4 and cyclinD1, were examined by western blotting analysis. *P < 0.05, **P < 0.01, and ***P < 0.001 compared with the control.

