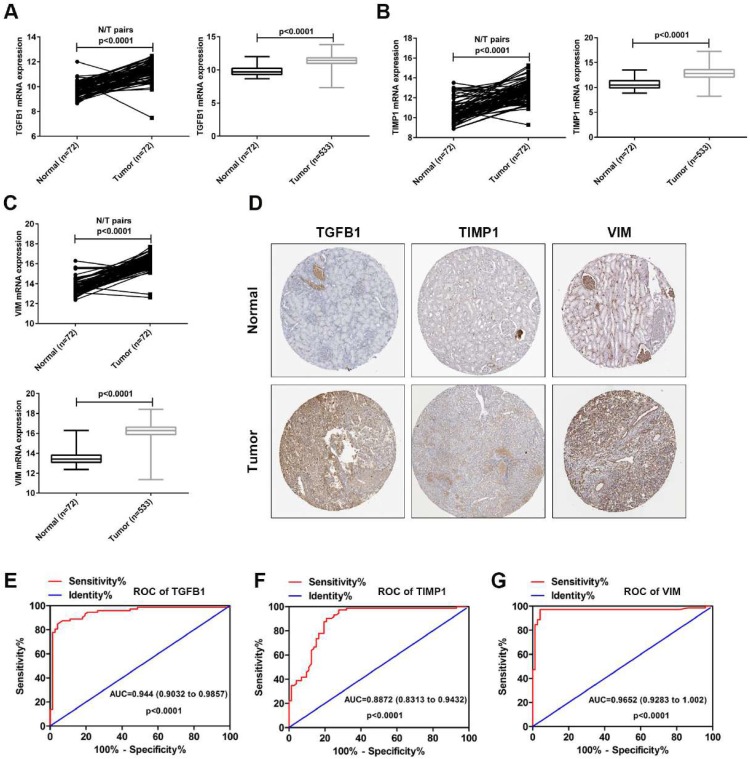
Figure 5.
The expression levels and diagnostic value of TGFB1, TIMP1 and VIM in ccRCC. (A) The mRNA expression levels of TGFB1 in paired and unpaired ccRCC tissues from TCGA. (B) The mRNA expression levels of TIMP1 in paired and unpaired ccRCC tissues from TCGA. (C) The mRNA expression levels of VIM in paired and unpaired ccRCC tissues from TCGA. (D) The protein expression levels of TGFB1, TIMP1 and VIM in ccRCC from HPA. (E-G) The ROC curve analysis of TGFB1, TIMP1 and VIM in ccRCC tissues from TCGA.

