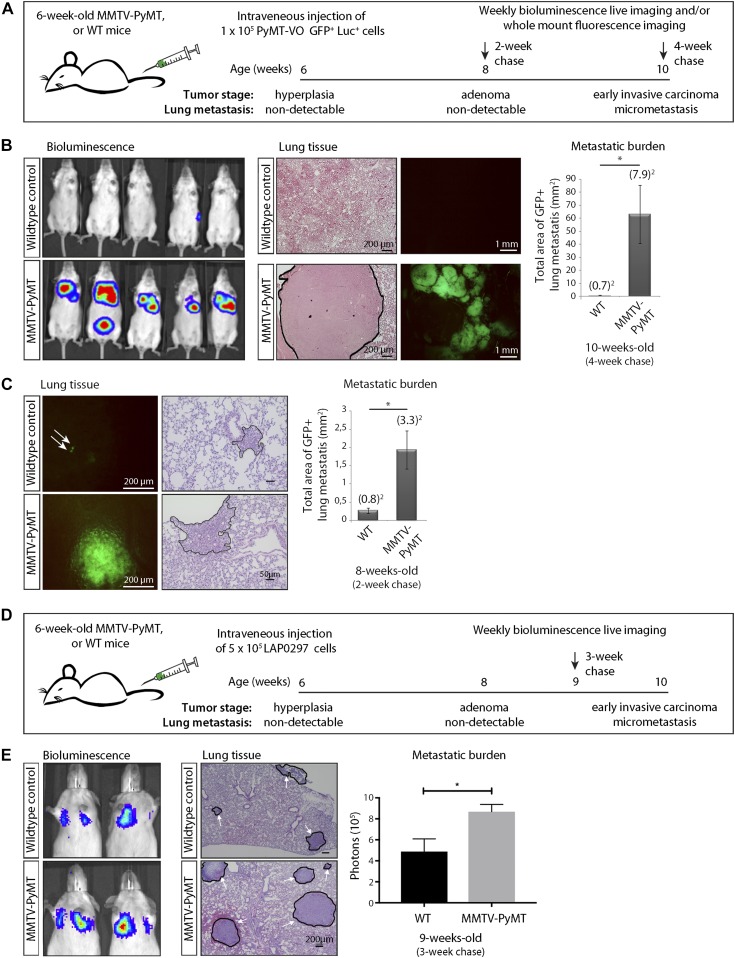
Figure 1. Characterization of a pre-metastatic niche in the lungs of MMTV-PyMT mice.
The lung microenvironment of hyperplastic MMTV-PyMT mice is permissive to the growth of i.v. injected circulating VO-PyMT tumor cells. (A) Schematic of the experimental setup: 6-wk-old MMTV-PyMT mice or WT littermate controls were i.v. injected with 1 × 10⁵ VO-PyMT-GFP-Luc cells. The mice were monitored weekly using bioluminescence imaging and euthanized 2 and 4 wk after i.v. injection. The lungs were evaluated by whole-mount fluorescence imaging to detect and quantify lung metastases. (B) Left: bioluminescence imaging of WT littermate control (top) and MMTV-PyMT (bottom) mice 4 wk after i.v. injection of VO-PyMT-Luc-GFP probing cells (n = 10 WT and n = 10 PyMT). Middle: left—representative hematoxylin and eosin (H&E)–stained images of lung metastases in WT littermate control and MMTV-PyMT mice. Scale bar is 200 μm; right—representative fluorescent whole lung images of WT control and MMTV-PyMT mice. Right: metastatic burden as quantified by the GFP+ signal in WT control and MMTV-PyMT mice (n = 13 WT and n = 15 PyMT, P = 0.032) 4 wk after i.v. injection of VO-PyMT-GFP-Luc cells. (C) Left: representative fluorescent whole lung images after a 2-wk chase in WT control and MMTV-PyMT mice. Scale bar is 200 μm. White arrows point to GFP+ metastatic foci. Middle: representative H&E images of lung metastases in WT littermate control and MMTV-PyMT mice. Right: quantification of the metastatic burden after a 2-wk chase in WT control and MMTV-PyMT mice (n = 11 WT and n = 12 PyMT, P = 0.014). (D) Schematic of the experimental setup: 6-wk-old MMTV-PyMT mice or WT littermate controls were i.v. injected with 5 × 10⁵ LAP0297-GFP-Luc cells. Mice were monitored weekly using bioluminescence imaging and euthanized 3 wk after i.v. injection. The lungs were evaluated by whole-mount fluorescence imaging to detect and quantify lung metastases. (E) Left: bioluminescence imaging of WT control (top) and MMTV-PyMT (bottom) mice after i.v. injection with 5 × 10⁵ LAP0297-GFP-Luc probing cells. Middle: representative H&E images of lung metastases in WT control and MMTV-PyMT mice after a 3-wk chase. Scale bar is 200 μm. White arrows point to regions of metastatic foci. Right: quantification of bioluminescence signal in WT control and MMTV-PyMT mice i.v. injected with LAP0297-GFP-Luc cells (n = 4 WT and n = 4 PyMT).

