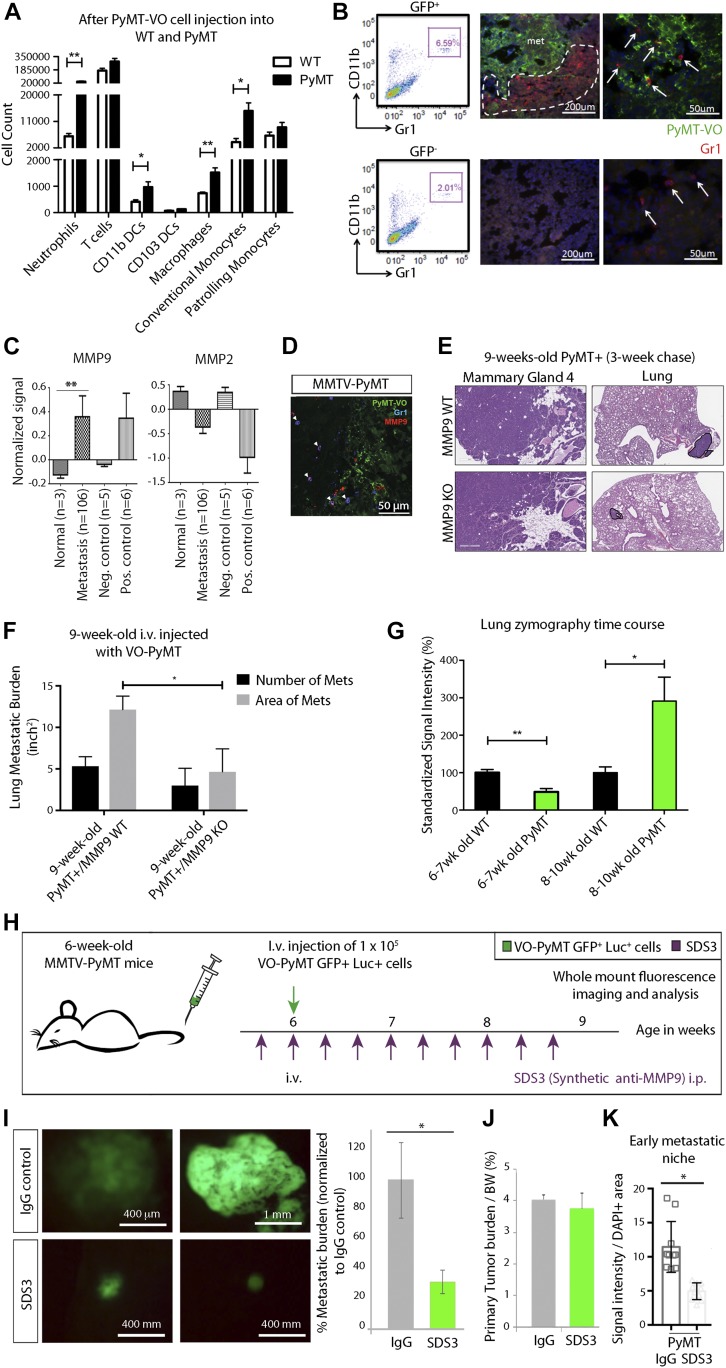
Figure 2. MMP9 is present in cells within the metastatic microenvironment.
Early niche formation is accompanied by increased inflammatory CD11b+Gr1+ myeloid cells that surround islands of metastatic cells in the lung. (A) Flow cytometric quantification of neutrophils (Ly6G+CD11b+), T Cells (CD3+CD11b−), CD11b DCs (CD11b+CD103−), CD103 DCs (CD103+CD11b−), macrophages (CD11c+Ly6C+Ly6G−), conventional monocytes (Ly6C+CD11c−), and patrolling monocytes (CD11c+Ly6Clow) gated on live CD45+ in the lungs of 9-wk-old WT littermates and MMTV-PyMT females 3 wks after i.v. injection of VO-PyMT-GFP-Luc cells (n = 4 WT, n = 3 MMTV-PyMT). (B) Left: flow cytometry analysis of CD11b+Gr1+ cells in GFP+ and GFP− areas of MMTV-PyMT 2 wk after i.v. injection of VO-PyMT-GFP-Luc cells. Middle and right: confocal microscopy of 8-wk-old MMTV-PyMT lungs stained with GFP (green) to mark the injected VO-PyMT-GFP-Luc cells and Gr1 (red). Nuclei are stained with DAPI. Gr1+ (arrows) cells accumulate around the metastatic GFP+ foci but not in GFP− areas. (C) Bioinformatics analysis of 90 BC patients with nine matched pair samples of chest wall, lymph node, lung, liver, and spleen (Waldron et al, 2012). MMP9 is significantly increased (P = 0.0014) across various metastatic organs, whereas MMP2 is decreased across various metastatic organs compared with primary breast tumors. (D) Confocal microscopy of MMTV-PyMT lungs stained with GFP (green), MMP9 (red), and Gr1 (blue) shows colocalization of MMP with Gr1+ cells (denoted by arrowheads). (E) VO-PyMT-GFP-Luc cells were i.v. injected into 6-wk-old MMTV-PyMT; Mmp9 WT or MMTV-PyMT; Mmp9 KO. H&E images of the primary tumor and lung in Mmp9 WT and Mmp9 KO mice after a 3-wk chase. (F) Quantification of the lung metastatic burden in MMTV-PyMT; Mmp9 WT and MMTV-PyMT; Mmp9 KO mice after i.v. injection of VO-PyMT-GFP-Luc cells (n = 4 MMTV-PyMT+; Mmp9 WT, n = 3 MMTV-PyMT+; Mmp9 KO). Mammary gland scale bar is 300 μm and lung scale bar is 700 μm. (G) Quantification of in situ zymography in lungs of WT control and MMTV-PyMT mice at various ages encompassing the hyperplasia to carcinoma transition (6–7-wk old: n = 6 WT, n = 7 MMTV-PyMT; 8–10-wk old: n = 4 WT, n = 4 MMTV-PyMT). Four serial sections stained. (H) Schematic of experimental setup: SDS3 or IgG (isotype control) is preinjected i.p. into 6-wk-old MMTV-PyMT mice. 1 d later, 1 × 10⁵ VO-PyMT-GFP-Luc cells, along with SDS3 or IgG, are i.v. injected into the mice. Subsequently, SDS3 or IgG is i.p. injected every other day for eight additional injections. (I) Left: whole-mount lung fluorescence imaging of lung metastases in MMTV-PyMT mice treated with SDS or IgG. Right: quantification of metastatic burden in MMTV-PyMT mice treated with SDS or IgG. (n = 8 IgG and n = 9 SDS3; *P = 0.02). (J) Quantification of primary tumor burden/body weight in MMTV-PyMT mice treated with SDS or IgG (n = 8 IgG and n = 9 SDS3, P = not significant). (K) Quantification of in situ zymography of the lungs in SDS3 and IgG-treated MMTV-PyMT mice (n = 3 each).

