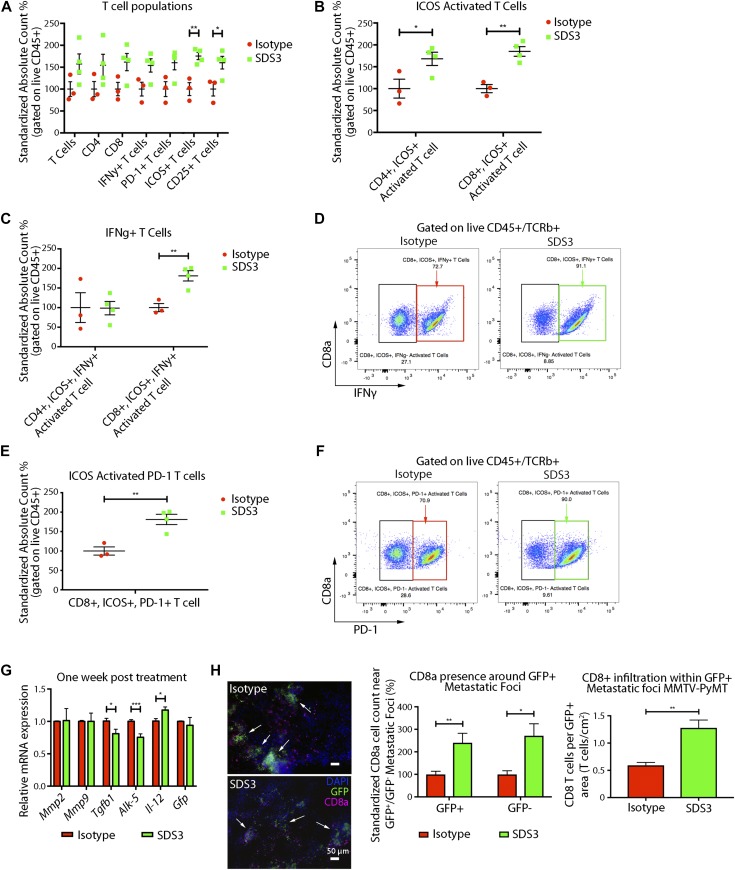
Figure 6. SDS3 promotes CD8+ T cell activation and T cell infiltration.
(A) Flow cytometry analysis of early immune changes within the lungs of MMTV-PyMT mice i.v. injected with 1 × 10⁵ VO-PyMT-GFP-Luc cells at 7 wk of age treated with SDS3 or IgG isotype control. Counting beads used to normalize frequencies with absolute cell counts standardized to isotype control expressed as a relative difference from the average isotype control absolute cell count. Significant activation of T cells seen through marked elevation of ICOS and CD25 (n = 3 IgG, n = 4 SDS3). (B) Flow cytometry analysis of ICOS-activated T cells reveals both CD4 and CD8 T cell subsets significantly up-regulated after SDS3 treatment. (C) Flow cytometry analysis of IFNγ within CD4- and CD8-activated T cells (ICOS+) demonstrates prominent Th1 cytokine skewing of CD8 T cells after SDS3 treatment. (D) Representative scatterplot of ICOS+ CD8 T-cell expression of IFNγ. Red box represents IgG-treated activated CD8 T cells expressing IFNγ. Green box represents SDS3-treated activated CD8 T cells expressing IFNγ. (E) Flow cytometry analysis of PD-1 within CD8+-activated T cells (ICOS+) shows significant up-regulation of an exhausted T-cell response due to overactivation of the immune system. (F) Representative scatterplot of ICOS+ CD8 T-cell expression of PD-1. Red box represents IgG-treated activated CD8 T cells expressing PD-1. Green box represents SDS3-treated activated CD8 T cells expressing PD-1. (G) qPCR analysis of MMTV-PyMT lungs i.v. injected with 1 × 10⁵ VO-PyMT-GFP-Luc cells 1 wk after IgG or SDS3 treatment shows decreased Th2/M2-like markers (Il-4r and Egr2) and increased Il-12 (duplicate conditions with n = 4 IgG and n = 4 SDS3). (H) Left: representative immunofluorescence images of 9-wk-old MMTV-PyMT lungs i.v. injected with 1 × 10⁵ VO-PyMT-GFP-Luc cells 3 wk after IgG or SDS3 treatment. CD8+ T cells localize around GFP+ metastatic sites (arrows) after IgG and SDS3 treatment, whereas lower presence of CD8+ T cells seen around GFP− sites. Middle: quantification of CD8+ T cells in GFP+ and GFP− regions 3 wk after IgG and SDS3 treatment (not shown: GFP− foci). Right: CD8+ T cell infiltration around periphery and within GFP+ metastatic foci in MMTV-PyMT mice at 9-wk of age after a 3-wk chase post i.v. injection of 1 × 10⁵ VO-PyMT GFP+ cells (n = 5 IgG, n = 5 SDS3; three serial sections used for quantification).

