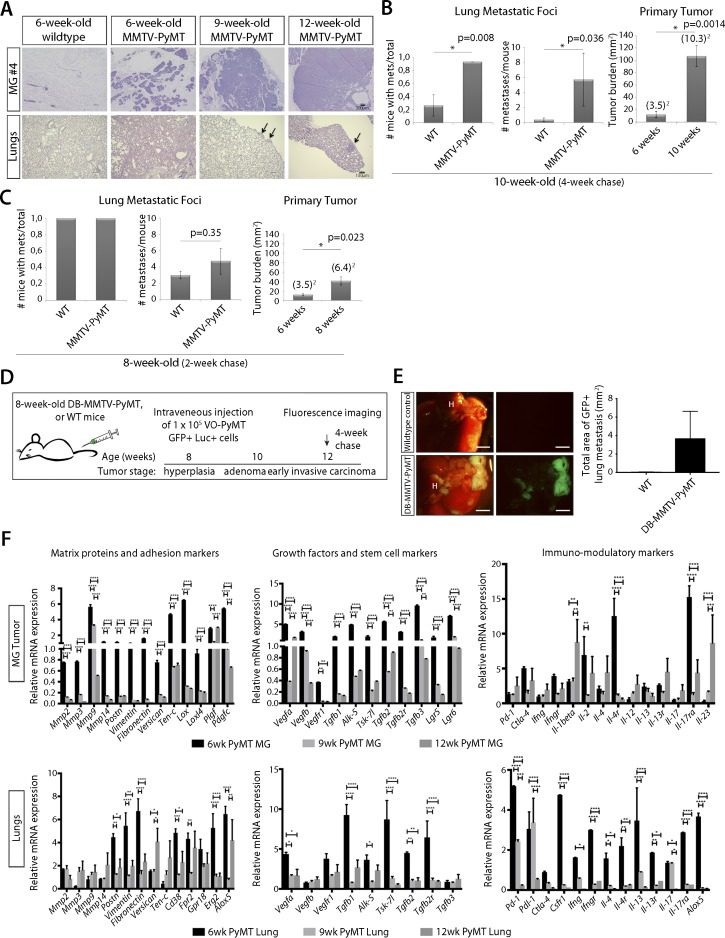
Figure S1. Characterization of MMTV-PyMT primary tumor.
(A) H&E images of mammary glands and lung from MMTV-PyMT mice and WT littermate control mice of 6-, 9-, and 12-wk of age. Arrows denote regions of metastatic foci. (B) Left: quantification of the number of mice with metastasis after a 4-wk chase reveals a significant difference between WT and MMTV-PyMT. Middle: quantification of the number of metastases per mouse after a 4-wk chase reveals a significant difference between WT and MMTV-PyMT mice. Right: quantification of primary tumor burden after a 4-wk chase in MMTV-PyMT mice at 6-wk-old versus 10-wk-old mice shows a significant increase in primary tumor burden. (C) Left: quantification of the number of mice with metastasis after a 2-wk chase. Middle: quantification of the number of metastases per mouse after a 2-wk chase. Right: quantification of primary tumor burden after a 2-wk chase in MMTV-PyMT mice at 6-wk-old versus 8-wk-old mice shows a significant increase in primary tumor burden. (D) Schematic of the experimental setup: 8-wk-old DB-MMTV-PyMT mice or WT littermate controls were i.v. injected with 1 × 10⁵ VO-PyMT cells. Mice were monitored by weekly bioluminescence live imaging to chase the i.v. injected VO-PyMT cells. 3 wk after i.v. injection, the mice were euthanized for whole-mount fluorescence imaging to detect and quantify lung metastases. (E) Left: representative images of whole lung metastases in 4-wk chased (12-wk-old) DB-MMTV-PyMT mice and WT littermate control. Scale bar is 2 mm. Right: quantification of metastatic burden from DB-MMTV-PyMT mice and WT control (n = 3 WT, n = 4 DB-MMTV-PyMT). (F) qPCR analysis of primary tumor and lungs from 6-, 9-, and 12-wk-old MMTV-PyMT and WT littermate control mice of ECM proteins, adhesion, angiogenesis, and immune-modulating markers that supports priming of the lungs early in primary tumor formation. The permissiveness of metastatic colonization in MMTV-PyMT mice occurred not only because of direct oncogene-induced changes in the lung microenvironment but also through primary tumor-induced systemic changes. All age-points are compared with their respective WT littermate. Statistical significance calculated using Student’s two-tailed t test with *P ≤ 0.05, **P ≤ 0.01, ***P ≤ 0.001, ****P ≤ 0.0001.

