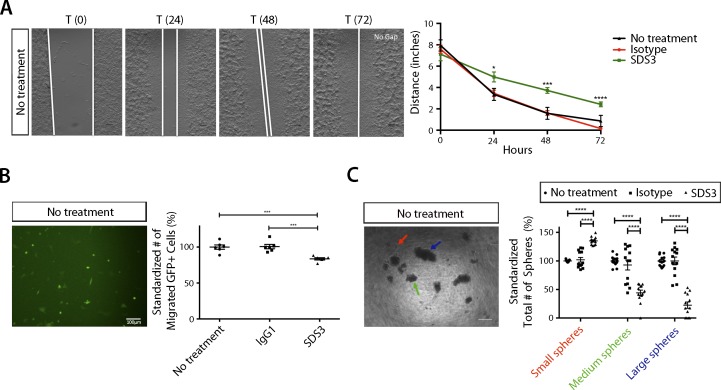
Figure S5. Examination of no treatment on VO-PyMT cells reinforces SDS3 inhibiting migration, invasion, and colony formation.
(A) Left: no treatment-representative image of scratch assay. Right: quantification of scratch assay with no treatment (n = 4 no treatment). (B) Left: no treatment-representative image of trans-well migration assay. Right: quantification of migration assay with no treatment condition (n = 6 no treatment). (C) Left: no treatment-representative images of sphere assay. Right: quantification of no treatment versus isotype control and SDS3-treated spheres standardized to no treatment condition (n = two biological replicates with seven replicates per condition and five images per well quantified).

