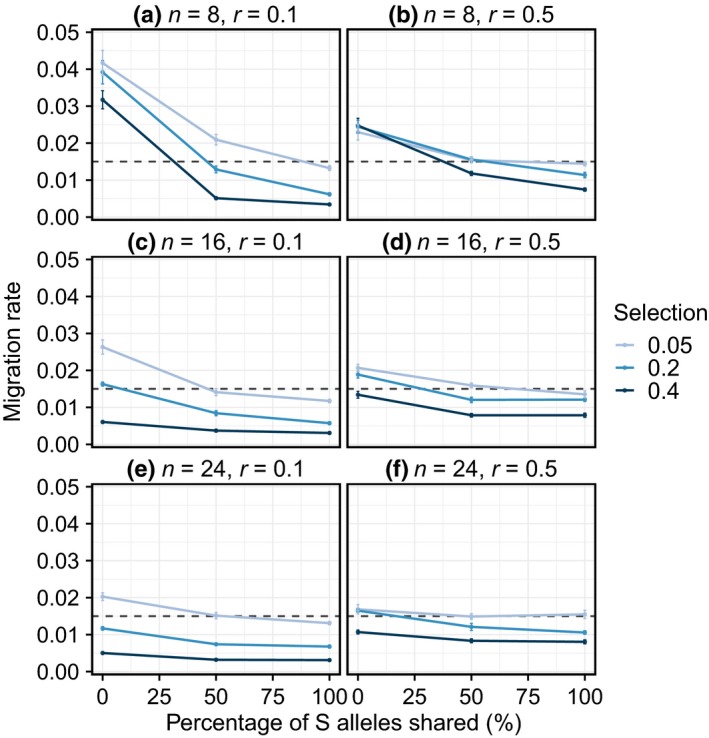
Figure 4.

The effect of varying the strength of selection (s = 0.05, 0.2, 0.4) and the number (n = 8, 16, 24) and percentage sharing (none, 50%, 100%) of S alleles on effective migration rate. Panels (a, c, e) are for a recombination rate (r) of 0.1 between the barrier locus (hybrid unfitness) and the neutral locus used to estimate effective migration rate, while (b, d, f) are when r = 0.5, representing no physical linkage between the neutral and barrier locus. Figures show means ± SE for 20 replicates of each combination of parameters. Effective migration rate was measured at a neutral locus over the first 25 generations (see Supporting Information Methods S2). The dashed line shows the actual migration rate (m = 0.015).
