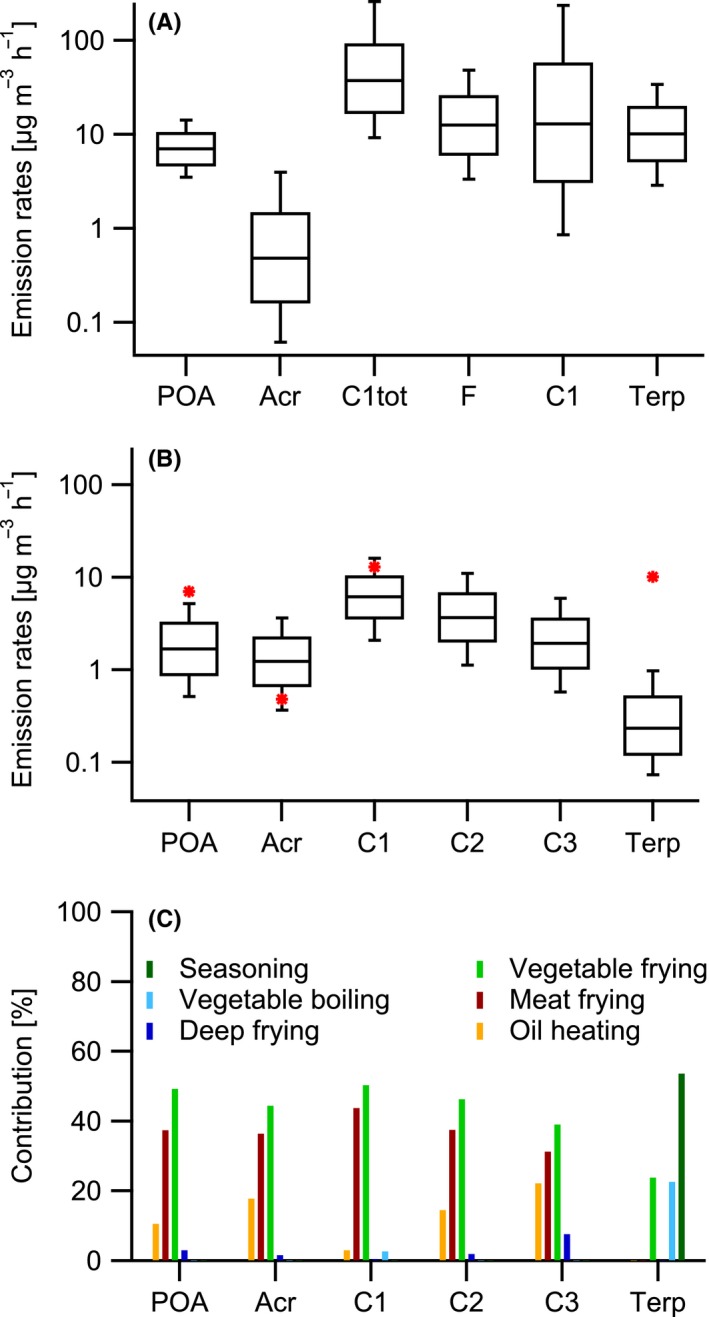
Figure 2.

Production rates of POA and organic gases from cooking and other indoor sources. Mean values as well as 5th and 95th percentiles (whiskers) and 25th and 75th percentiles (box) are shown for modeled total indoor source emission rates from Waring (2014) 34 (A) and for modeled cooking emission rates from this study (B) as well as the contributions of the different cooking processes to the total emissions (C) of POA, acrolein (Acr), formaldehyde (F), saturated carbonyls with less than 6 carbons (C1tot) or excluding formaldehyde (C1), saturated aldehydes with more than 5 carbons (C2), unsaturated carbonyls with more than 5 carbons (C3), and terpenes (Terp). Red stars in B are median values from A
