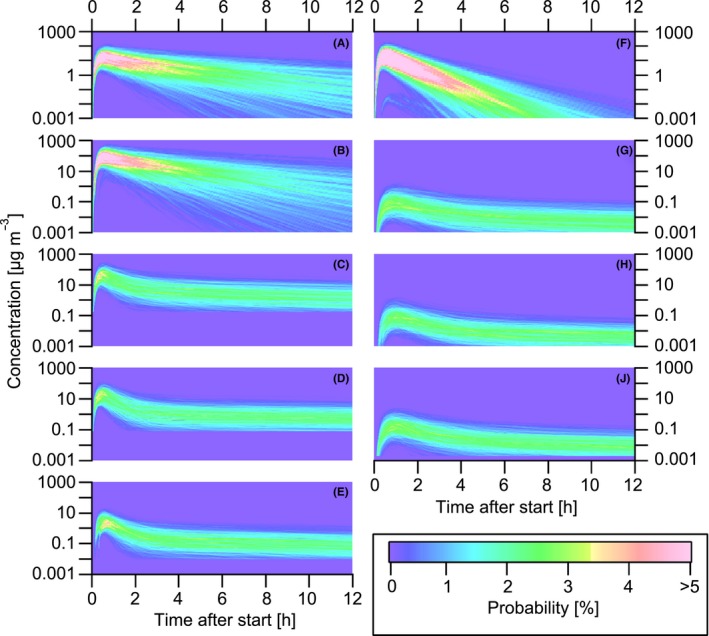
Figure 4.

Time‐dependent probability density functions of indoor pollutant concentrations in European homes originating from Occidental style cooking processes. The left‐hand panels show the evolution of the gaseous pollutants, acrolein (A), saturated carbonyls with less than six carbons (B), saturated carbonyls with more than 5 carbons (C), unsaturated carbonyls with more than 5 carbons (D), and terpenes (E). The right‐hand panels show the evolution of the particulate species, POA (F), SOA formed from carbonyl oxidation (G), SOA formed from terpene oxidation (H), and total SOA formed (J)
