Figure 5.

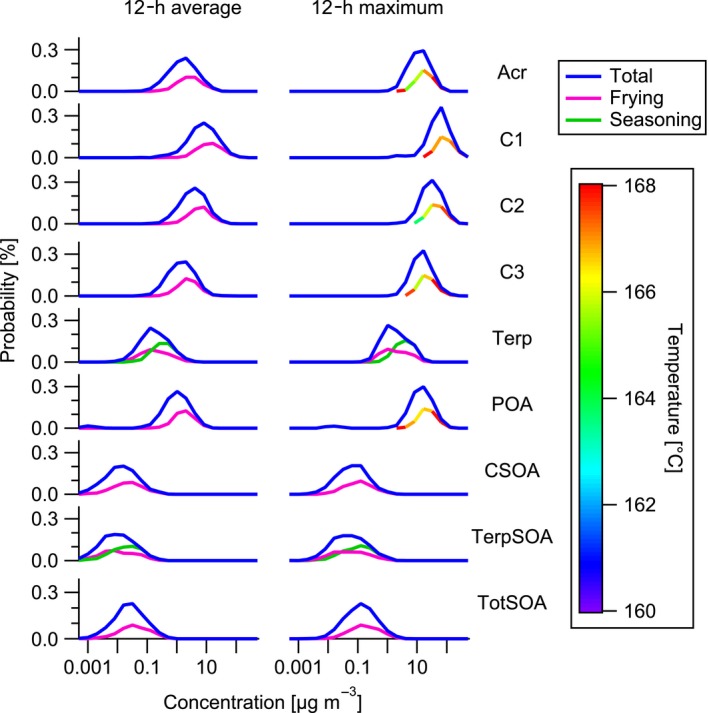
Probability density functions of 12‐h average and maximum indoor pollutant concentrations in European homes originating from frying processes, the use of seasoning, and the total of all cooking processes. The frying is color coded by the average cooking temperature if relevant for the compound emissions. The left‐hand panels show the 12‐h averages, and the right‐hand panels show the maximum concentration of acrolein (Acr), saturated carbonyls with less than six carbons (C1), saturated carbonyls with more than five carbons (C2), unsaturated carbonyls with more than five carbons (C3), terpenes (Terp), primary organic aerosol (POA), SOA formed from carbonyl oxidation (CSOA), SOA formed from terpene oxidation (TerpSOA), and total SOA formed (TotSOA)
