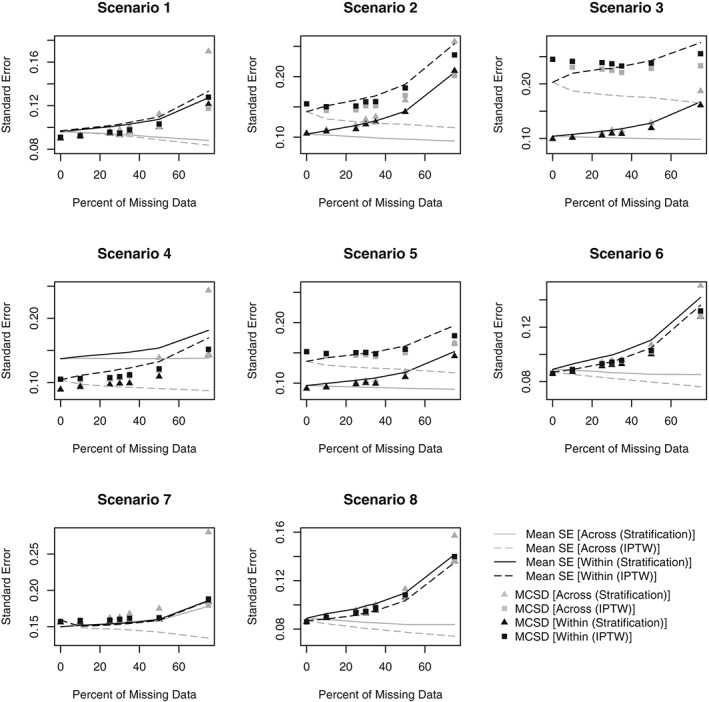
Figure 3.

Standard error (SE) of estimate and Monte Carlo standard deviation (MCSD) by percent of missing data for Scenarios 1‐8 (for datasets with 50% prevalence of exposure). Scenario 1: One confounder, strong positive association with treatment, continuous outcome, data missing at random. Scenario 2: Three independent confounders, strong positive associations with treatment, continuous outcome, data missing at random. Scenario 3: Three correlated confounders, strong positive associations with treatment, continuous outcome, data missing at random. Scenario 4: Three correlated confounders, strong positive and negative associations with treatment, continuous outcome, data missing at random. Scenario 5: Three correlated confounders, moderate positive associations with treatment, continuous outcome, data missing at random. Scenario 6: Three correlated confounders, weak positive associations with treatment, continuous outcome, data missing at random. Scenario 7: Three correlated confounders, weak positive associations with treatment, binary outcome, data missing at random. Scenario 8: Three correlated confounders, weak positive associations with treatment, continuous outcome, data missing not at random. IPTW, inverse probability of treatment weighting
