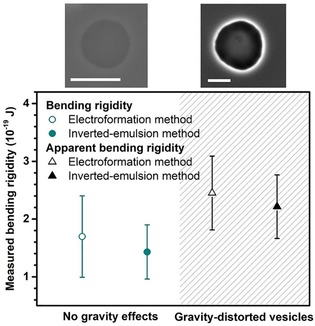
Figure 8.

Bending rigidity measurements of POPC GUVs produced by electroformation (open symbols) and inverted emulsion methods (solid symbols). The vesicle interior contains 600 mOsm sucrose. Data are shown for preparations where the gravity effects were overcome by replacing the external 600 mOsm glucose solution (black symbols; hatched area) with a solution of 25 mOsm glucose and 575 mOsm sucrose (dark cyan). Mean data are shown with error bars taken from the standard deviation (n≥10). Snapshots above the graph show phase contrast images of GUVs under the respective conditions. Note that for 600 mOsm glucose in the outer solution, the contrast is enhanced due to an increased refractive index difference. Scale bars: 50 μm.
