
Figure 5.
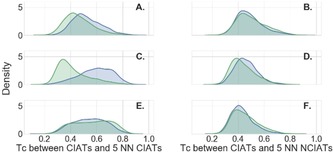
Density plots of the average distribution of Tc of true positive CIATs (blue) and false negative CIATs (green) in relation to their five nearest neighbors among CIATs (plots A, C, E) and NCIATs (plots B, D, F) in their corresponding training sets in RFC. Plots A and B, C and D, E and F correspond, respectively, to AlphaScreen, FRET, and TR‐FRET.