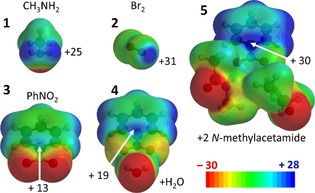
Figure 1.

Electrostatic potential maps (MEPs) of model compounds. MEPs shown at isodensity surface of 0.002 a.u. of some σ‐holes (1 and 2) and π‐holes (3–5) with their electropositive potential maps in kcal mol−1 (MP2/aug‐cc‐pVDZ//B3LYP/6–31+G*, see also section 1.1. of the Supporting Information).
