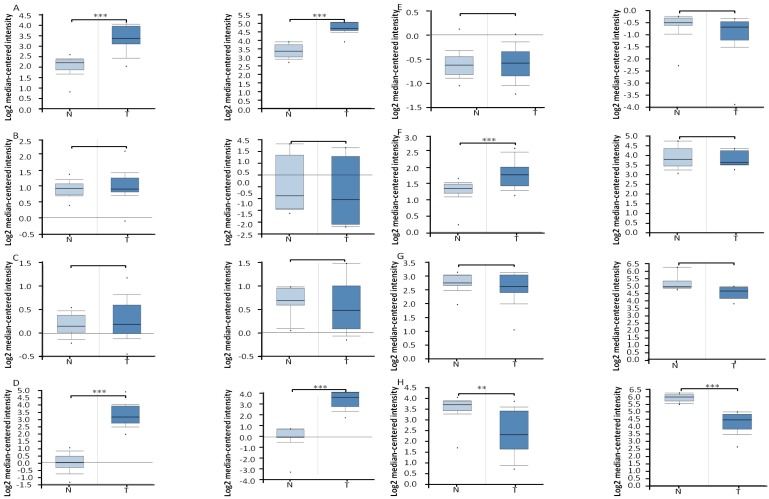
Figure 2.
The box plots demonstrated the mRNA expression profile of FA metabolic enzymes in ccRCC and in normal kidney tissues, which was downloaded from Oncomine database. The box plots showed the relative mRNA expression of ACLY (A), ACC (B), FASN (C), SCD (D), CPT1A(E), HADHA (F), HADHB (G), and ACAT1 (H), in U133A (left, 32 cases of ccRCC and 23 cases of normal kidney tissues) and U133A/B (right, 10 cases of ccRCC and 10 cases of normal kidney tissues) microarrays datasets, repectively. * P<0.05, ** P<0.01, *** P<0.001.

