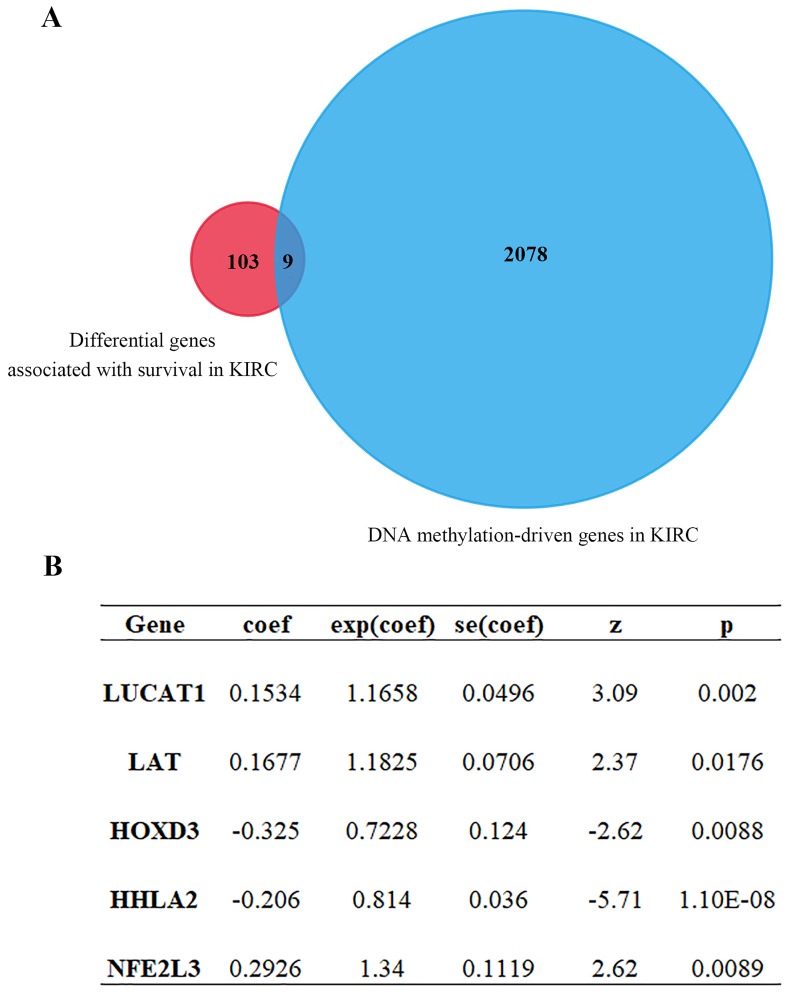
Figure 3.
Cox proportional-hazards model analysis and MethylMix R package analysis. (A) Venn diagram showing intersection genes expression between gene set 1 and gene set 2 (9 genes). Gene set 1 is differential genes associated with survival; Gene set 2 is DNA methylation-driven genes. (B) 5 optimal gene models obtained by multivariate Cox analysis.

